Executive Summary
Philanthropic support for promoting a healthy democracy has grown in recent years, marking a period of transformation for the field. Since 2016, an influx of funding, actors, and philanthropic infrastructure has amplified the impact of pro-democracy efforts while infusing the movement with needed dynamism.
At the same time, from a funder perspective these developments mean that today’s ecosystem is increasingly complex, confusing, and difficult to navigate. Sustaining the benefits of this transformation while avoiding the pitfalls of rapid growth requires a full understanding of funder capacities and needs.
Drawing insights from interviews and surveys conducted with 70 institutional funders, this report sheds new light on the state and direction of the democracy funding landscape. It describes:
- Field Magnitude and Growth — estimates of the size, scope, and directionality of democracy-related philanthropic funding.
- Field Focal Areas — insights on major focal areas for funding today, how that has changed over time, and where additional funding may be needed in the future.
- New Actors and Infrastructure — lessons on the experiences of newer funders and the evolving field of funding intermediaries.
- Looking Ahead — outstanding questions for future research and opportunities to strengthen the funding field.
Field Magnitude and Growth: Significant Growth from Institutional Philanthropy
It is well understood by those in the field that funding for democracy-related work has grown dramatically since 2016. Many survey respondents and interviewees note concern that this growth may soon wane. However, this research shows significant and sustainable funding growth from institutional philanthropy, even as questions remain about trends in other sources of field funding. Findings in this report include:
- Among survey respondents, funding for democracy-related work is estimated to have grown between 42 percent and 61 percent in four years.
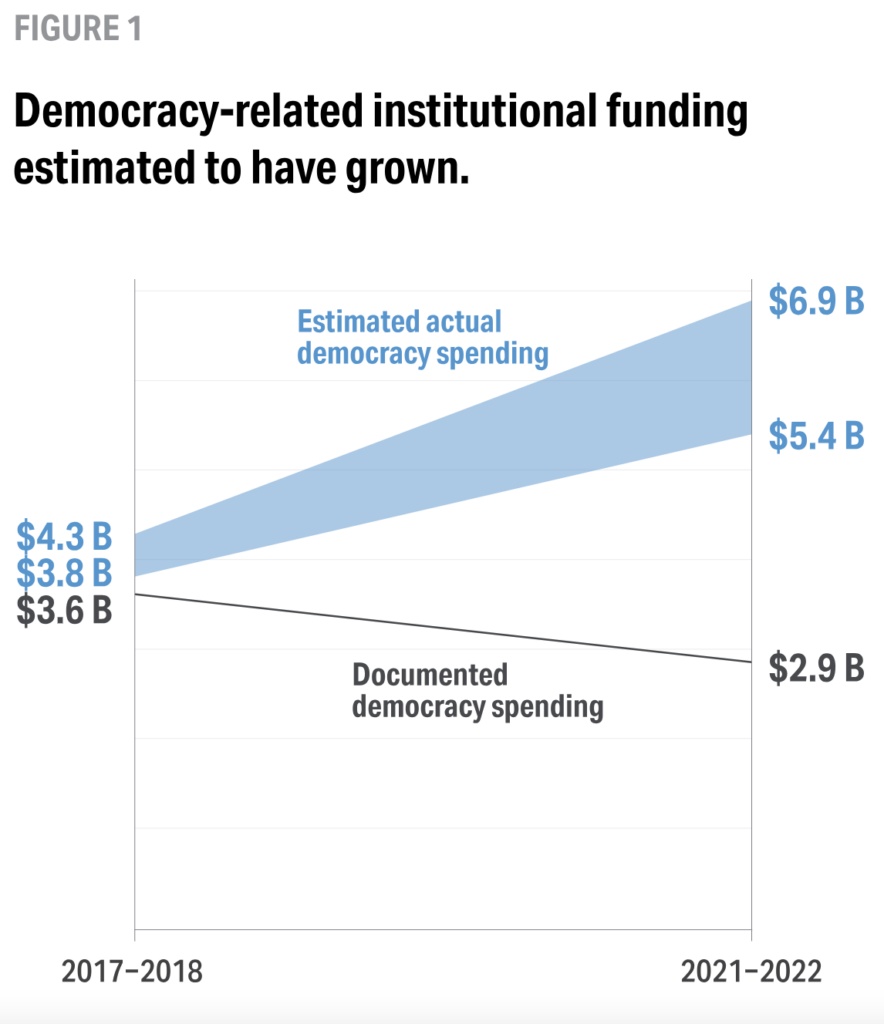
- If other funders who were not surveyed grew at a similar rate, we estimate institutional philanthropy for democracy to have grown from between $3.8 billion and $4.3 billion in 2017–2018 ($1.9 billion and $2.1 billion on average per year) to between $5.4 billion and $6.9 billion in 2021–2022 ($2.7 billion and $3.4 billion on average per year).
- Despite this growth, democracy funding remains small compared to that for other issues. The high estimate of $3.4 billion per year would account for only 0.7 percent of all philanthropic funding in the U.S. in 2022.
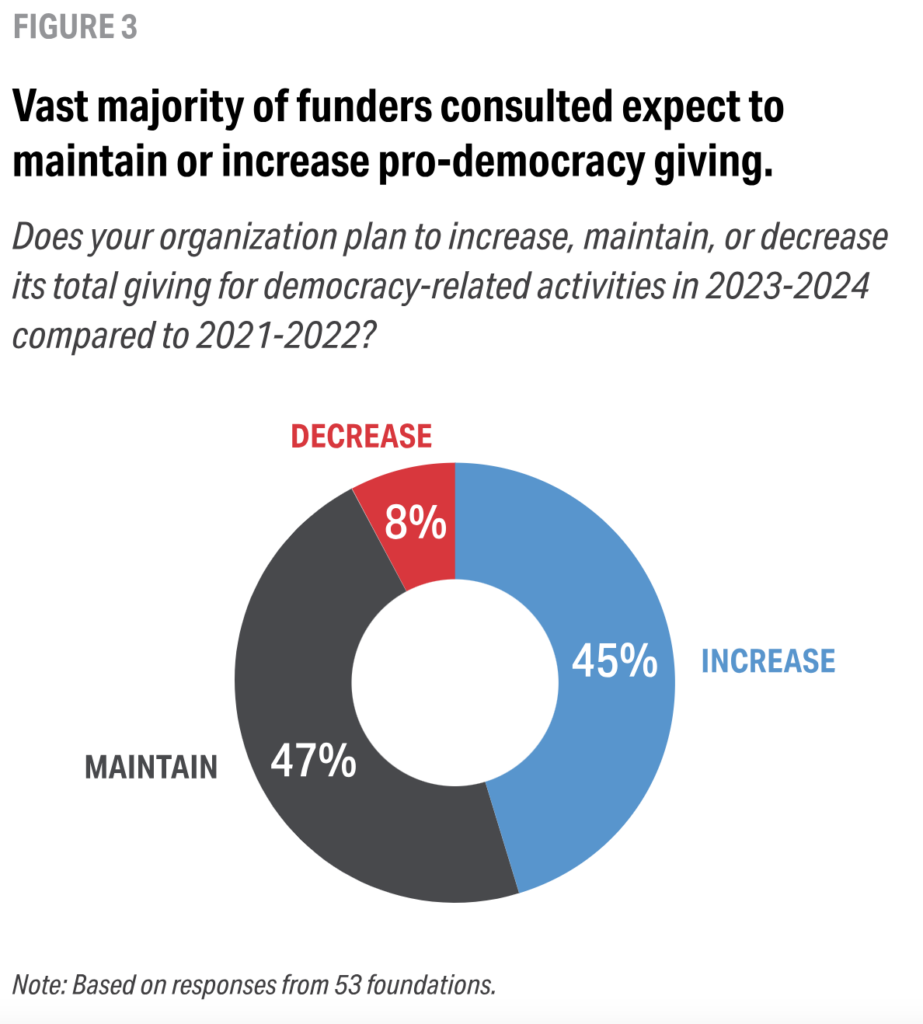
- Institutional philanthropic funding for democracy is expected to grow further in 2023–2024, with 45 percent of survey respondents planning to increase funding and just 8 percent planning to decrease it compared to 2021–2022.
- Surprisingly, the majority (57 percent) of survey respondents report having increased funding in 2021–2022 relative to 2019–2020 — during the last U.S. presidential election cycle — showing less cyclicality in funding from institutional philanthropy than expected.
- Long-term and unrestricted funding is becoming more common across institutional philanthropy, despite concerns that funding growth has focused on short-term goals.
- Importantly, these data provide insight into plans and trends among institutional funders, but field stakeholders remain concerned about trends in funding from other sources — including individual donors — especially as many grantees report fundraising challenges.
Field Focal Areas: Democracy Field Shifting and Maturing to Respond to Emerging Threats
The set of issues viewed by funders as core to the health of democracy includes many that have long been the focus of field efforts, while also incorporating newer foci that have emerged in response to evolving threats to democratic institutions and processes. Some recently expanded foci relate to threats that predate our institutions themselves, such as white supremacy and racial inequity, which philanthropy has historically played a role in exacerbating.
Other issues have come to the fore as a result of rapid technological change. Findings in this report include:
- Voting and elections issues remain core to the field. Survey respondents cited efforts to protect voting rights (76 percent), election administration (73 percent), and voter engagement (86 percent) most often when describing work they funded in 2021–2022.
- Survey respondents note strong and increasing support for newer focal areas, with 70 percent reporting funding for social and racial justice work and 59 percent reporting funding for media policy and misinformation and disinformation.
- Many of the same issues are viewed as being underfunded, with media policy and misinformation/ disinformation and election administration cited most often as areas in need of greater attention and focus from funders.
New Actors and Infrastructure: Growing Role of Newer Funders and Intermediaries
In recent years, the democracy field has also attracted a large influx of new funders and has spurred creation of a host of new funding intermediaries — all with different motivations, interests, and foci. This changing landscape has made the field more dynamic and complex, contributing to an appetite among funders to better understand the nature of this growth and how to best capture the benefits while avoiding potential pitfalls. Findings in this report include:
- The rise of authoritarianism is not the only driving factor in bringing newer funders to the field. Concerns about degrading democratic institutions and the interests and experience of new internal staff are also driving entrants to the space.
- New entrants to the democracy funding field find relationships and networking to be most helpful to success in their early years, followed by access to relevant research and fresh perspectives from new staff and board members.
- The number and role of funding intermediaries is growing, offering benefits, such as grantmaking convenience, and challenges, such as greater complexity of options.
Looking Ahead: Impact, Opportunity, and the Value of Community Building
Our research shows that the relatively small democracy funding field is growing and changing rapidly. And while these changes are viewed as positive overall, funders express a significant lack of clarity about the current funding landscape and even more uncertainty about what the future may hold. Growing in ways that meet the needs of the field and the moment requires building a far stronger community of funders and bridging current gaps in relationships, information, and funding approaches. Some opportunities include:
- Community building, including that which further supports and engages newer funders.
- Understanding grantee experiences, especially BIPOC-led and -serving organizations.
- Defining democracy work and its focal areas to bolster future efforts to map the field.
- Strengthening coordination across funders and across intermediaries.
- Identifying and filling gaps for key subfields of democracy work that are underfunded.
Foreword
This report intends to take a critical step in providing a stronger, more comprehensive understanding of the evolving field of democracy-focused philanthropy in the United States — about where it has been, where it may be headed, and how funder perceptions and realities on the ground compare. There are still lingering questions about the current state and future trends, and there is certainly a need for more coordinated research and data collection. All such insights can help field stakeholders best achieve our shared goals: protecting and strengthening American democracy.
How can philanthropy better support the movement for a more inclusive, multiracial democracy?
Over the coming months and years, Democracy Fund will work with grantees and funders to better understand where philanthropy has been most impactful and where we are falling short — with the goal of creating resources that support funders in doing better. One of the first steps in this process is understanding more about how philanthropy is supporting the field today.
By our estimate, institutional philanthropy is currently investing an average of $2.7 to $3.4 billion a year to support democracy. This is a remarkable commitment and represents a dramatic increase from where we were at just five years ago. But that figure doesn’t tell the whole story.
For democracy to thrive, we need significant long-term commitments to the pillars that support it. While it’s encouraging that democracy funding has increased significantly in recent years — by our estimates, somewhere between 42 and 61 percent growth from 2017–2018 to 2021–2022 — we must do more. And we can: Less than one percent of philanthropy was devoted to democracy in 2022, while other issue areas still receive far more attention and support.
We know firsthand that the increasing number of intermediaries, programs, and activities supporting democracy has made it harder to clearly understand where resources are most needed and where philanthropy has become part of the problem. The infrastructure the field has constructed is remarkable, but its complexity requires deeper study to help funders maintain confidence that resources are being allocated effectively.
Until now, we’ve lacked hard data and corresponding analysis about the current state and direction of pro- democracy philanthropy. We commissioned this report as a first step toward filling that gap — to establish a baseline from which we can measure trends in the field. We look forward to working with partners to develop and release more data and reports that can refine our collective understanding.
We intend for Democracy Fund to play an increasing role in helping provide an unbiased look at the state and direction of the field, as well as to help us all better understand what it means to be an effective democracy funder. We believe that better data and improved information sharing can strengthen the collective sense of identity and community across the wide range of institutions engaged in this work.
For that data and information to be useful, it must reflect the diversity of the pro-democracy community and America itself. This report is limited by the set of institutions we were able to engage in this process — and we know that it tells an incomplete story. In the future, we will broaden our inputs by engaging more partners in these discussions and future surveys.
We look forward to continuing our work with a broad range of funders — from the long-standing to the newly interested — in support of an inclusive, multiracial democracy that is open, just, resilient, and trustworthy. The growth we’ve seen has helped produce some remarkable impact, and now is the time to double down on support for the field.
Joe Goldman
President, Democracy Fund
Lauren Hill
Senior Director of Partnerships, Democracy Fund
Introduction
For years, philanthropic institutions funding democracy-related work have struggled to fully understand the size and scope of the field. As more actors enter the space with new priorities and interests, even defining the field is a complex task. Publicly available data on field investments has also been limited, a historical trend that has persisted in part because funders often choose to maintain anonymity in the face of increased polarization, media scrutiny, and rising political violence. Still, funders need current, relevant data to inform strategic decisions.
Democracy Fund surveyed and interviewed more than 70 funders engaged in democracy-related work to help establish some of this information. Based on an in-depth analysis of funder insights and their implications for the future of the field, this report seeks to provide:
- An up-to-date assessment of the size, scope, and directionality of democracy-related funding
- Insights on potential gaps in the field
- Details about the experiences of newer field funders that can bring more actors to the field and help recent entrants remain
Funders may use this report to inform their individual or collective funding strategies. Findings may be particularly valuable to new donors who wish to have a broader understanding of the space and its evolution.
The report includes aggregate data from survey respondents and quotes from respondents and interviewees — all of which have been anonymized. While more than 70 funders were engaged, the exact number engaged on any individual element or survey question varies. The report provides sample sizes for individual data points where applicable.
| RESEARCH INPUTS |
|
Surveys
- 70 survey responses and direct input from foundations describing their democracy-related funding and key trends
- 37 responding foundations shared topline funding totals for 2021-2022
|
Interviews/Qual Input
- 17 interviews with field stakeholders, including
- Funding intermediaries
- Newer funders (<5 years in field)
- Legacy funders (>5 years in field)
- Other key stakeholders
- Input on democracy issue categories from key anchor funders
|
Desk Research
- Candid data over time
- 40+ reports and articles from industry and mainstream sources, including:
- Funders
- Journals
- News outlets
|
Confidential Data
- Two sets of confidential internal democracy-related grant data – one for 2017- 2018 and one for 2021-2022 – each from a distinct sample of 12 foundations
- Used on background to inform and validate findings, and for additional insights where appropriate
|
Our survey was distributed to a broad set of funding institutions known by Democracy Fund as supporters of democracy-related work, including many that are long-tenured field funders as well as many that began funding in the space more recently. Expert interviews were conducted with newer funders, individual donors, funding intermediaries, and other stakeholders with knowledge of the democracy funding landscape.
KEY TERMS
Some field-related terms mentioned frequently within this report are:
- Institutional funders — registered foundations with sizeable endowments and annual payouts. These foundations’ grantmaking operations are typically managed by foundation staff, rather than by the founder(s) themselves or by outsourced consultants.
- Individual donors — people who may have a registered foundation with little to no staff, or who give directly or through an intermediary such as a donor-advised fund. While there are some exceptions, individual donor payouts tend to be smaller than those of institutional funders.
- Legacy funders — those who report having funded democracy work for more than five years.
- New(er) funders — those who report having funded democracy work for less than five years.
- Intermediaries — organizations and vehicles that support funders who prefer not to fund in this space directly or alone. Examples include donor-advised funds, fiscal sponsors, community foundations, and pooled funds/donor collaboratives.
- Funding cycles — research periods of two years that account for peaks and downturns that might occur alongside the U.S. election cycle, recognizing that election-related funding makes up a significant portion of spending in the democracy space. For example, we review data for the 2017–2018, 2019–2020, and 2021–2022 cycles.
Field Magnitude and Growth
Significant Growth from Institutional Philanthropy
KEY FINDINGS IN THIS SECTION
- Among survey respondents, funding for democracy-related work is estimated to have grown between 42 percent and 61 percent in four years.
- If other funders who were not surveyed grew at a similar rate, we estimate institutional philanthropy for democracy to have grown from between $3.8 billion and $4.3 billion in 2017–2018 ($1.9 billion and $2.1 billion on average per year) to between $5.4 billion and $6.9 billion in 2021–2022 ($2.7 billion and $3.4 billion on average per year).
- Despite this growth, democracy funding remains small compared to that for other issues. The high estimate of $3.4 billion per year would account for only 0.7 percent of all philanthropic funding in the U.S. in 2022.
- Institutional philanthropic funding for democracy is expected to grow further in 2023– 2024, with 45 percent of survey respondents planning to increase funding and just 8 percent planning to decrease it compared to 2021–2022.
- Surprisingly, the majority (57 percent) of survey respondents reported having increased funding in 2021–2022 relative to 2019–2020 — during the last U.S. presidential election cycle — showing less cyclicality in funding from institutional philanthropy than expected.
- Long-term and unrestricted funding is becoming more common across institutional philanthropy, despite concerns that funding growth has focused on short-term goals.
- Importantly, these data provide insight into plans and trends among institutional funders, but field stakeholders remain concerned about trends in funding from other sources — including individual donors — especially as many grantees report fundraising challenges.
Philanthropic interest in and support for promoting a healthy democracy have grown significantly in recent years, bolstered by an infusion of funding, actors, and infrastructure. Funders in this field have concerns about the sustainability of this interest, whether rapid growth has made the field more difficult to navigate, and what these changes to the funding landscape may mean for grantees and organizations on the ground.
This section of the report compares common perceptions about the funding landscape with what the data says about the size of the field and how it has changed since 2016. It also offers insights into primary drivers of that change and expectations for how it will evolve in the near future.
Funding from Institutional Philanthropy is Estimated to Have Grown 42 Percent–61 Percent from 2017 through 2022
To better understand the current landscape of philanthropic funding for democracy-related work and how it has grown and evolved since 2016, we leveraged several sources of data:
- Publicly available democracy-related grant data — taken from Candid’s “Foundation Funding for U.S. Democracy” tool, which maps all philanthropic funding for democracy-related work, for the time periods 2017–2018 and 2021–2022.
- An original survey of institutional funders — self-reported survey response data from 37 institutional funders, collected between April and August of 2023, describing their funding levels for democracy-related work in 2021–2022.
- Internal grant data for a small sample of participating foundations — two sets of confidential, internal democracy-related grant data — one for 2017–2018 and one for 2021–2022 — each from a distinct sample of 12 funding organizations, to compare with Candid data and survey data for validation and extrapolation.
To begin, we looked at the Candid database to assess both the overall amount of spending in the democracy space as well as how it has changed over time. Candid is a nonprofit that specializes in providing data and insights on U.S. nonprofits. In the 2017–2018 cycle, Candid documents about $3.5 billion in grants for democracy-related work from 9,144 funders to 12,493 grantees. By contrast, the same database documents only $1.7 billion in democracy- related funding across just 323 funders to 2,250 grantees in 2021–2022. Taken at face value, the database suggests a radical drop-off in both the number of funders and grantees as well as the overall amount of funding in the field.

While Candid is one of the most authoritative sources of data for U.S. philanthropic funding, there are several reasons to suspect these figures are underestimating the size of the field during both time periods. Candid’s methodology relies significantly on cataloging IRS data about philanthropic giving as well as submissions from philanthropic entities themselves. Because of this, the full amount of money going into democracy-related work may not be reflected for multiple reasons:
- There is a several-year lag in publication of IRS data — which means that it is often years before a fuller picture of the field for a given period is available.
- Cataloging IRS data is prone to under classification given the small amount of data available about any given grant.
- Institutional giving to re-grantors or intermediaries — an increasingly common practice in philanthropy — is difficult to classify because both the intent and the recipient of the grant are obscured.
In addition to these methodological issues, it also appears to be the case that Candid has not updated its democracy-related database to include all relevant data from the years of interest — due in part to the lag previously mentioned. For instance, when reviewing the broader Candid database of funding across issues — from which Candid’s democracy-related database draws its funding data — the “Democracy” and “Voter Rights” categories alone account for $3.5 billion in funding for 2021–2022, compared to just $1.7 billion in the democracy- related database.
This is obviously a problem for any kind of trend analysis using the democracy database as it would systematically undercount the amount of money in the field in recent years. Similarly, the data from Candid’s broader database, while helpful for validation on general sizing, employs a different taxonomy of issues than does the democracy database and our survey.
With all of these issues in mind, we leveraged a unique set of data — internal grantmaking records for 12 foundations with significant democracy portfolios during the 2017–2018 period — to see if these concerns were justified. In theory, we would expect these records to be more accurate about true funding levels for these institutions than the Candid database.
We compared the 2017–2018 data from Candid for these organizations with the records that the organizations themselves classified as being democracy-related and found a consistent undercount of funding. Specifically, Candid underestimated the size of these organizations’ democracy-related giving by anywhere from 3 percent to 93 percent — with an average of 20 percent undercount across all 12 institutions. Given that this period is well outside the typical IRS time lag, one conclusion is that this could mostly be explained by the other classification-related issues.
We conducted a similar exercise using the survey data described above. Specifically, 10 foundations that provided estimates of their democracy-related giving in 2021–2022 via our survey are included in Candid data for the period. When comparing these, the average undercount rate was 53 percent. While we believe that some of the same classification issues are at play, these exercises confirmed that despite Candid being the most comprehensive database currently available, some combination of these concerns result in it undercounting funding in the field. And while we highly suspect the self-reported data we have collected from institutional funders is more accurate on a case-by-case basis, it is limited in that it describes funding from dozens rather than hundreds or thousands of organizations.
With this in mind, we chose to triangulate between these three sources of data — leveraging the strength of each to better estimate both the size of the field and trends over time.
As a first pass, we created estimates for the size of the field using only funding that was directly documented. Specifically, that means funding that was documented in the Candid database in either period, in the 12 institutional internal funding records from 2017–2018, or in the 37 institutional survey responses for 2021–2022.
Using this method, the total funding mapped goes from $3.5 billion to $3.6 billion in 2017–2018 and $1.7 billion to $2.9 billion in 2021–2022.
However, based on earlier comparisons between Candid data and these other sources of funding information, we have substantial reason to believe that the undercounting in both time periods is systemic. Taking those concerns seriously, we chose to develop an upper- and lower-bound estimate using undercount and growth rates from these records and survey data to enhance estimates from Candid.
To create our first estimate — the upper-bound estimate — we generally assumed that the undercounting and growth trends we document in our records and survey data are consistent across all organizations in the democracy space.
Specifically, for 2017–2018 we assume that the 20 percent rate of undercounting found for the smaller sample of 12 organizations in 2017–2018 is consistent across all funders in Candid’s database. Adjusted for that undercount, we would now estimate that funding in that period was closer to $4.3 billion.
To estimate democracy funding totals for 2021–2022, we make two calculations. First, we compare self-reported democracy funding totals for 2021–2022 among survey respondents with the undercount-adjusted Candid totals for the same foundations for 2017–2018. This analysis suggests funding among these organizations for democracy- related work grew by an estimated 61 percent over the period. Specifically, 81 percent (25 of 31 for which data were available) of funders in this sample are estimated to have increased their funding over the period — often by substantial amounts — while just 19 percent (six of 31) decreased their funding.
Second, assuming the same growth rate for all funders in Candid’s data for 2017–2018, we project the magnitude of funding among this larger sample to have grown from $4.3 billion in 2017–2018 ($2.1 billion on average per year) to $6.9 billion in 2021–2022 ($3.4 billion on average per year).,
The reason we consider this an upper-bound estimate is that it is entirely possible that the undercounting and growth trend estimates from our sample of records and survey respondents is not representative of the larger universe of democracy funders. In the case of the undercounting, the 12 organizations for which we have internal funding data from 2017–2018 represent institutions that are relatively large. It is certainly possible that the methodological issues that lead to undercounting in Candid are more likely to manifest among these larger organizations. If true, this would overestimate the rate of undercounting in Candid.
Similarly, it is certainly possible that foundations that increased their democracy-related funding during this period were more likely to respond to our survey. If true, this would over-estimate the rate of growth between 2017–2018 and 2021–2022.
Given these concerns, we also created what we’ll refer to as the lower-bound estimate. In this projection, we assumed the rate of undercounting in Candid for other funders was only half the rate found in this project (10 percent, instead of 20 percent) and that those funders experienced only half the rate of growth between these two periods (30 percent, instead of 61 percent). Under these assumptions, we estimate the field has grown from $3.8 billion in 2017–2018 ($1.9 billion on average per year) to $5.4 billion in 2021–2022 ($2.7 billion on average per year).
While under no illusions about the potential issues with the assumption behind these projections — discussed more fully below — we believe they represent a good faith and comprehensive attempt to marry disparate and imperfect sources of data.
Democracy Funding in Context
Despite growth within the field, democracy funding accounted for less than 1 percent of philanthropy in the United States in 2022, and many noted concerns that field funding is still not sufficient to meet the scale of challenges and needs. Giving USA — a public service initiative that produces an annual report that provides a comprehensive look at all philanthropic giving in the United States — reports that total giving across all issue areas in 2022 at roughly $500 billion
Our estimate of $3.4 billion in average funding per year for democracy work would amount to 0.7 percent of this total. Though democracy funding has grown more quickly than all philanthropy since 2018 (61 percent versus 17 percent) and its share has increased over time, other discrete issue areas still saw far greater investment in 2022.
In this context, many continue to see democracy as an area of underinvestment, particularly given that a healthy democracy is a critical prerequisite to realizing change and impact in other fields. As one interviewee put it, democracy-related investment “could unlock impact in other downstream areas.”
Limitations of Data and Analyses
In the course of conducting research, it is always worthwhile to take a step back and consider the ways in which a given source of data may be flawed or otherwise limited. In this case, our analysis is based in large part on self-reported survey data and therefore subject to a wide variety of potential issues. While we stand behind the analysis presented above, it is worth considering potential sources of bias:
- Aggregate trends and funder perspectives inherently miss grantee experiences — These estimates describe field funding and growth in the aggregate, based on surveying funders. However, the experience for individual grantees and field organizations will certainly vary. In particular, BIPOC-led organizations and those serving underrepresented communities historically have been disadvantaged in receiving philanthropic funding. It is entirely possible, and even probable, that the distribution of this funding growth was unequal and that the overall growth reported here does not reflect the experiences of every organization. For instance, BIPOC-led organizations may have had significantly more difficult experiences entering the field than funders overall. This is an important area for future research.
- Definitions of democracy work differ across data sources, impacting comparability — The categories of work included in Candid’s taxonomy of the field (used to assess 2017–2018 funding) differ slightly from those used for the survey (used to assess 2021–2022 funding). The taxonomy used for the survey was designed as an update to Candid’s taxonomy, with a goal of rearranging categories and understood sub-areas to better match current field foci. For instance, our taxonomy includes a dedicated category for social and racial justice work — an area of significant focus for field funders particularly of late — yet much of this work likely fell within prior existing categories, such as the civil liberties and rule of law category and the issue-based participation category. Therefore, some amount of the estimated growth over time could be attributed to changes in definitions, potentially biasing estimates upward given the more expansive taxonomy. A fuller discussion of the new taxonomy and the changes included are described in this report’s section on Field Focal Areas, as well as in the Appendix.
- Estimates rely on data about funders in 2017–2018, yet the population of funders in this field has likely shifted — These totals are also limited to estimated growth among funders included in Candid’s database as of 2017– 2018, which primarily consists of institutional philanthropy. This sample inherently excludes newer field entrants since that period, while also including some institutions that may have stopped funding in the space. It also does not appropriately account for funding and growth from individual donors, as not one funder in this sample was categorized by Candid as an “Individual” donor. If this research were to capture these other sources of funding, the overall magnitude of estimated field funding would be larger, and the estimated growth over the period also might be higher.
- Survey sample is possibly biased toward funders with larger funding growth — The survey was distributed to a set of funders known to Democracy Fund as supporting democracy work, due to existing awareness and relationships as well as publicly available information. Of those that received the survey, only 47 percent responded to the survey or otherwise provided topline information on their democracy funding. It is possible that funders who are decreasing funding or exiting the field entirely may have been less likely to be included in the initial sample and less likely to respond to the survey even if they were included. If true, this would lead us to overestimate both the size of the field today and its growth over the period analyzed.
- Datasets may contain different amounts of 501(c)(4) funding data — Survey data included in these calculations account for only 501(c)(3) funding, while Candid data are intended to be inclusive of both 501(c)(3) and 501(c)(4) funding. However, it is unclear to what extent Candid data for 2017–2018 accounts for 501(c)(4) funding, and how large this amount would be relative to the total funding for the period. If the data in Candid for 2017–2018 includes large amounts of 501(c)(4) funding, this would lead us to underestimate the rate at which Candid undercounts 501(c)(3) funding and would likely lead us to underestimate growth in 501(c)(3) funding over the period.
Institutional Philanthropy for Democracy Work is Expected to Grow Further in 2023–2024
Even with the understanding that the field of democracy funders has grown since 2016, the future remains unclear. Many note anxiety that recent field growth may decline — both in the number of funders engaged and the amount of funding available — based on the sense that the worst crises of recent years have passed. In particular, these concerns often center on newer field funders and individual donors viewed as less committed to the space long- term. Several survey respondents shared these sentiments:
- “I’m worried that some of the new energy and funding that came out of the 2016–2020 era is starting to drop.”
- “I think there is a growing complacency and lack of urgency around these issues as a result of Trump no longer being in office, when in fact the authoritarian threat is growing, not decreasing.”
- “I hear that overall giving is down and there is some donor fatigue in play, which is concerning given the challenges and opportunities in the space at the moment.”
These concerns align with reports from grantees and grassroots organizations that fundraising for nonpartisan democracy work related to the 2023–2024 election cycle has been slower than in recent cycles, particularly from individual donors — a trend described anecdotally by interviewees.
While funding trends from newer funders and individual donors are difficult to predict, it should be encouraging to note that most of the institutional funders that responded to our survey plan to increase or maintain funding levels going forward. Of respondents, 45 percent (24 of 53) reported that they plan to increase democracy-focused funding in 2023–2024 from that issued in 2021–2022, and 47 percent (25 of 53) reported that their funding will stay the same. Only 8 percent (four of 53) reported that they plan to decrease funding.
Some survey respondents noted that 2023–2024 funding decisions, while expected to increase or remain constant, had yet to be finalized. In part, this was due to internal planning dynamics, as funders indicated they were still in the process of developing programmatic goals and strategies. Others note this was a deliberate delay to see what issues or funding gaps emerge — reflecting both a response to concerns about potential funding shortfalls as well as a potential factor contributing to slow field fundraising to date.
With the combination of delays in funding decisions by institutional philanthropy and reported fundraising challenges from individual or newer donors, it is understandable that grantees are feeling cross-pressured, finding resources scarce at a time when many expected to be expanding operations.
Respondents were also asked what led to changes in their funding priorities between the 2021–2022 and 2023– 2024 funding cycles. The most common reason funders identified for both changing their funding strategy and increasing funding was a desire to grow support for specific subtopics. For instance, one respondent shared that “the foundation has shifted its focus to center racial justice and equity, [addressing root causes,] structural racism, and systems change.” Another shared that “[the foundation] intend[s] to deepen [its] work on election infrastructure and misinformation and disinformation.”
CAVEATS TO PLANNED FUNDING FINDINGS
There are three caveats to consider when looking at findings about planned funding growth:
- Some growth may be cyclical — although survey data suggest less cyclicality than expected — Given that 2024 is a U.S. presidential election year, some of this expected increase in funding may be cyclical. However, there are reasons to believe that this represents real non-cyclical growth. A similar number of survey respondents also reported having increased (57 percent, 30 of 53) or maintained (28 percent, 15 of 53) funding in 2021–2022 relative to 2019–2020 — despite the latter being the past presidential election cycle. Taken at face value, this may suggest more funding stability between electoral cycles overall within institutional philanthropy. In the reasons survey respondents gave for increased funding over the period, some did point to time-bound crises that won’t persist — such as funding responses to the events of January 6, 2021 — still many noted a broader range of factors that we might expect to sustain over time, e.g., a number reported increased support for media and journalism issues.
- Survey sample is possibly biased toward funders planning to increase funding — These findings may be subject to sample bias, as those expecting to decrease funding in the space may have been less likely to respond to the survey. Further, high-net-worth donors who may have been more recent entrants in the field were not included substantially in the survey. If true, our findings may represent an overly rosy picture of future funding plans among not only institutional funders, but also the field writ large.
- Aggregate trends may differ from grantee experiences — It is worth noting that the trends among funders identified here would not necessarily align with the experiences of individual grantees. It may be the case that increased funding disproportionately serves new grantees or flows through new intermediaries, and therefore may not result in higher funding levels for pre-existing organizations. Further, we know from prior research that BIPOC-led nonprofits and those serving communities of color tend to receive less support than their white-led and white-serving counterparts. Thus, while indicators of increased funding levels overall is a positive sign, we should be cautious in how we interpret the impact this has for organizations on the ground.
Multiyear and Unrestricted Funding are Becoming More Common Across Institutional Philanthropy
Several interviewees and survey respondents cited concerns that the field lacks sufficient long-term and unrestricted funding for grantees. In particular, newer funders and individual donors were perceived as being overly focused on short-term goals. As two respondents noted:
- “It’s great that there’s a heavy focus on elections, but so little long-term thinking [is] happening in the democracy”
- “Some donors do not provide predictable, reliable, consistent funding to organizations to be able to sustain their work year-round and create multiyear plans for the future.”
However, while it may be difficult to assess the focus of newer funders and individual donors on these approaches, survey respondents report high levels of long-term and unrestricted funding, as part of a trend across philanthropy overall to move toward trust-based practices. The majority of survey respondents (62 percent) reported that at least half of their 2021–2022 democracy-related grants are multiyear versus one year or less. Similarly, the vast majority (72 percent) report that at least half their grants are for general operating support.
Increasingly, it appears that multiyear grants and general operating support are becoming normalized among institutional funders of democracy work. For example, among foundations that made confidential 2017–2018 internal data available, the majority reported higher rates of both general support and multiyear grants in 2021–2022 than appears in their grantmaking data for the prior period.
As one respondent noted:
“[The foundation] started supporting grantees in the longer term after the 2016 election because [its staff] were concerned that the issue of voting rights was not going away. [The staff] listened to [its] grantees about the need for consistent, multiyear funding and now [the foundation is] approaching more of [its] democracy funding from a long-term perspective.”
Despite these trends, grantees continue to voice the need for more long-term support, and more improvements in this regard may well be warranted. For instance, in internal grant data for select foundations, we found that while 50 percent of democracy-related grants made in 2021–2022 were for at least 24 months, just 23 percent of grants exceeded two years, and less than 10 percent of grants exceeded three years.
Additionally, the length of grants likely differs across issue areas. For instance, in reviewing confidential 2021–2022 grantmaking data for select foundations, grants for voting rights and voter engagement work were 15 percent shorter on average (18 months) than all other grants (21 months), while those for civil liberties and rule of law were 22 percent longer on average (26 months).
Stakeholders Continue to be Concerned about Timing of Funding and 501(c)(4) Funding Levels
Interviewees and survey respondents also shared concerns about the timing of field funding. Many noted that funding often reaches grantees too late to be most useful, especially in the context of election-related funding. Some also reported feeling that 501(c)(4) funding levels are too low overall. Unlike 501(c)(3) funding, 501(c)(4) funding enables social welfare organizations to engage in unlimited lobbying activities related to the organization’s exempt purpose and engage in limited partisan activity, such as endorsing candidates or conducting get-out-the-vote campaigns based on party affiliation, though such partisan activities cannot be its primary purpose.)
Survey respondents note a trend toward grants coming later within election cycles, as funders increasingly take a “wait and see” approach before setting funding strategies, in hopes of better targeting funds to areas of greatest need and opportunity. While this can enable responsiveness to emerging challenges, it can also make it difficult for grantees and funders alike to plan ahead and leverage funding fully. In the words of one respondent: “I worry about funding moving too late, when groups need early resources to be most effective and impactful.”
Some evidence bears this out. For instance, one interviewee from a funding intermediary, in reviewing funding flows, noted that “there is a drop-off in democracy funding across the board and it’s coming in later…” However, the same interviewee also noted that “things always drop off and then pick back up later,” suggesting increased funding levels could be expected to eventually materialize, albeit with shifts in timing.
There is a perception that this trend is especially true for funding from individual donors. However, it is apparent even in institutional philanthropy. Many survey respondents described their own approach in similar ways, noting that with current information they aren’t yet ready to lock in strategies for the 2023–2024 cycle. For instance, one respondent shared: “Depending on emerging threats we may increase funding in certain areas to meet the moment. It is still too early to know.”
Funders also note concern that work to promote a healthy democracy has too little 501(c)(4) funding and share a perception that “anti-democracy” efforts are better resourced in this regard. Of those surveyed, most respondents (74 percent, 26 of 35) indicated they do not have an affiliated 501(c)(4) that funds democracy-related work. Respondents that do (23 percent, eight of 35) reported just over $105 million in annual 501(c)(4) funding for related activities in 2021– 2022. Just 12 of the 141 funders (9 percent) included in the survey distribution have easily identifiable 501(c)(4) affiliates.
This point was reinforced by a representative from a pooled fund who noted “a lot of funders are not experienced with the (c)(4) side.” One interviewee shared that their “biggest criticism of the democracy field is that there isn’t more (c)(4) funding. (c)(3) funders aren’t sufficient.”
Some stakeholders note that some newer funders to the field — particularly individual donors who have traditionally engaged in campaign and political funding — have brought more 501(c)(4) funding to the table. However, stakeholders also convey some wariness that these trends could amplify perceptions that the field is becoming increasingly political or partisan.
Field Focal Areas
Democracy Field Shifting and Maturing to Respond to Emerging Threats
KEY FINDINGS IN THIS SECTION
- Voting and elections issues remain core to the field. Survey respondents cited efforts to protect voting rights (76 percent), election administration (73 percent), and voter engagement (86 percent) most often when describing work they funded in 2021–2022.
- Survey respondents note strong and increasing support for newer focal areas, with 70 percent reporting funding for social and racial justice work and 59 percent reporting funding for media policy and misinformation and disinformation.
- Many of the same issues are viewed as being underfunded, with media policy and misinformation/disinformation and election administration cited most often as areas in need of greater attention and focus from funders.
The democracy funding field includes a broad and growing array of focal areas, actors, and funders. The set of issues seen by funders as core to the health of democracy includes many that have long been the focus of field efforts, while also incorporating newer foci that have emerged in response to evolving threats to democratic institutions and processes. Some recent foci relate to threats that predate our institutions themselves, such as white supremacy and racial inequity, which philanthropy has historically played a role in exacerbating. Others target newer trends resulting from rapid technological change.
Given this shifting landscape and the increasing understanding of the fundamental role a healthy democracy plays in ensuring effective outcomes in other issue areas, it can be difficult to neatly define what constitutes “democracy-related work.” Unsurprisingly, many stakeholders report confusion — and even frustration — in trying to navigate the space and their role in it.
This section of the report details the areas of democracy-related work included in this study and how this set of focal areas has evolved over time. It also provides insights on the relative attention that different sub-issues have received and notes where increased attention from funders may be warranted.
Democracy Field Maturing to Include New Focal Areas, Greater Intersectionality
In order to better understand the current field of democracy philanthropy today, there must first be a clear understanding of what that field includes. Unfortunately, field stakeholders note the lack of a broadly shared definition for what falls within the boundaries of democracy work today — often leading to questions and confusion.
In 2015, Candid worked with a broad set of field stakeholders to develop a seminal shared taxonomy of issue areas included in the democracy field.To date, this taxonomy remains the most widely used. However, in more recent years — particularly in response to major events and emerging threats since 2016 — the field has developed newer focal areas that were not explicitly included in this prior taxonomy. In many cases, areas of work that were previously understood as sub-fields or minor foci — perhaps as a part of other definitions or captured in Candid’s “Other” category — require more dedicated categorization today.
For the purposes of this study, we worked with a collection of stakeholders in the funder community to develop potential updates to the Candid taxonomy that could account for recent trends and newer focal areas. The resulting taxonomy, described in detail in the
Appendix, includes several areas of new and increased focus in recent years, including:
- Ensuring an effective census and redistricting process
- Promoting racial and social justice
- Preventing political violence and anti-hate efforts
- Tracking and combating misinformation and disinformation
In addition to a changing landscape of focal areas within democracy work, stakeholders also note a greater understanding of the fact that democracy-related work is deeply intertwined with other issue areas, which is seen as a significant cause for recent funding growth. For instance, some funders may invest in voter education and outreach in order to catalyze action on climate change. Others may fund government effectiveness and reform efforts in order to support better administration of programs of interest, such as the implementation of new federal funding for infrastructure.
These types of investments from funders seeking impact in other areas are becoming more common. One survey respondent shared that more funders are entering the space because “there is an appreciation that progress cannot be made on other issues (health, climate) without philanthropic attention on underlying democracy issues.” This has brought more engagement in democracy work, but also contributes to perceived confusion over what types of work and funders are or are not included in the conception of the field.
CATEGORIES OF DEMOCRACY WORK INCLUDED IN SURVEY
Voting and Elections†
- Voting Rights†
- Voter Education and Engagement†
- Election Administration
- Campaign Finance
- Redistricting
Inclusion, Equity, and Justice*
- Social and Racial Justice*
- Social Cohesion and Polarization*
- Political Violence and Anti-Hate*
Civic Education and Participation†
- Civic Education and Leadership
- Public and Issue Based
- Participation‡
- Census*
Government Effectiveness and Democracy Protection†
- Civil Rights/Liberties and Rule of Law†
- Government Oversight and Reform‡
Media and Information Ecosystem†
- Journalism‡
- Media Policy and Mis/ Disinformation†
General/Non-Issue Specific*
Other Issues
Differences from Candid’s original taxonomy of democracy-related funding
* Not previously included as a dedicated category
† Updated title only
‡ New category created by combining existing categories
Full definitions for each category, as provided to survey participants, are included in Appendix.
Broad Engagement Across Issue Areas, Including Newer Foci
Survey respondents supported a wide breadth of issues in 2021–2022, with each area of work receiving support from many funders.
Among our survey respondents, voter education and engagement (86 percent, 32 of 37), voting rights (76 percent, 28 of 37), and election administration (73 percent, 27 of 37) were the most commonly funded areas in the democracy space in 2021–2022. These issues have seen larger investment in recent years. For instance, campaigns, elections, and voting issues accounted for just 9 percent of all democracy funding recorded by Candid in 2016, while funding for these issues increased to 26 percent in 2020.
The survey also shows significant interest and support for issues that were not historically core areas of field focus. Nearly 70 percent of respondents (26 of 37) report having funded social and racial justice work in the 2021–2022 cycle; this area has not always been considered by philanthropy, with its historically white and elite biases, as a dedicated category of work. Additionally, 59 percent (22 of 37) report funding for media policy and combating misinformation and disinformation, while 54 percent (20 of 37) report funding for journalism. These are areas that have matured alongside the fast-evolving media, technology, and information landscape.
However, when reviewing internal grant data from a sample of 12 foundations, including 2,403 grants totaling $1.1 billion, we found that the volume and funding across these categories varied significantly.
For instance, in this sample, areas with far more grants and funding include social and racial justice work and public and issue-based participation. By contrast, voting rights, voter education and engagement, and election administration have fewer grants and less funding, despite the largest number of funders having reporting funding in these areas in our survey.
Areas with the smallest number of grants and far less funding in this sample included those that are off cycle, such as redistricting and census, as well as areas that are more targeted in nature, such as social cohesion and anti-hate. These analyses are highly dependent on the accuracy of issue-coding performed by our team, based on reading grant purpose statements provided directly by funders.
Of funders that reported increased funding in the 2021–2022 cycle relative to the 2019–2020 cycle, many explicitly noted increased focus on racial justice issues, COVID-19 related issues, and misinformation and disinformation.
Some areas of work that had attracted a greater share of efforts to promote a healthy democracy in prior eras — such as campaign finance and government oversight and reform work — were supported by a minority of survey respondents in the 2021–2022 cycle and appear lower in the sample of internal grant data. Interestingly, of the 12 survey respondents who report they have funded causes in the democracy space for less than five years, none reported having funded these areas in 2021–2022.
These newer funders were slightly more likely to report having funded voting rights, voter engagement, and election administration efforts than did legacy funders. They also reported especially heavy engagement in newer field focal areas like social and racial justice, as well as misinformation and disinformation.
Funders Note Greater Attention Needed on Media Issues and Election Administration
Survey respondents note a broad range of potential areas of need for the field moving forward, underscoring the diversity of interests and approaches across funders working in the democracy field. When asked which areas of democracy-related work need greater attention from funders, no area received more than 50 percent of responses.
Issues relating to building a healthy information ecosystem rise to the top as needing greater attention. This includes media policy, misinformation, and disinformation (38 percent, 20 of 53) as well as journalism (28 percent, 15 of 53). Two more respondents used the open-ended response to specifically note artificial intelligence and algorithms as areas of concern, which may be considered as possible sub-issues within the misinformation and disinformation space.
Given that these media and technology-related issues are newer areas of focus generally, these findings may be unsurprising and suggest room for continued growth and engagement. Importantly, some respondents noted significant new initiatives, investments, and engagement in these areas. And many conveyed optimism that related work will continue to grow and attract more funders.
The second largest number of respondents (36 percent, 19 of 53) note election administration as needing greater focus. This aligns with both the growing threats to fair elections seen in recent years as well as with concerns shared by field stakeholders that some funders may incorrectly believe these threats are now behind us. One funder noted that “election security is not well funded. The integrity of elections and elected officials being supported is not something that often comes to mind in the democracy space.”
New Actors and Infrastructure
Growing Role of Newer Funders and Intermediaries
KEY FINDINGS IN THIS SECTION
- The rise of authoritarianism is not the only driving factor in bringing newer funders to the field. Concerns about attacks on democratic institutions and the interests and experience of new internal staff are also driving entrants to the space.
- New entrants to the democracy funding field find relationships and networking to be most helpful to success in their early years, followed by access to relevant research and fresh perspectives from new staff and board members.
- The number and role of funding intermediaries is growing, offering benefits, such as grantmaking convenience, and challenges, such as greater complexity of options.
Newer democracy field funders — institutional funders and individual donors that have begun funding democracy-related work in the past five years — have contributed to growth of the democracy field as well as its increased complexity. The field today consists of a more varied set of funders, engaged on a wider set of issues, and exhibiting a broader set of motivations and interests.
Additionally, there are more resources and infrastructure for funders, including growth in the size and number of funding intermediaries. These allow for coordination and alignment across this ecosystem — from rapid- response pooled funds supporting election security to networks for building learning communities around civic engagement and political polarization. This growth has allowed the field to become more dynamic and complex.
Field stakeholders are now beginning to grasp the threats and opportunities that this growth in diversity, dynamism, and complexity may mean for the future of the field. Several lingering questions we encountered are:
- Whether newer funders will remain in the field
- Which resources may be most useful for keeping them in the field
- The best strategies to build a philanthropic community that can welcome these newer funders and their unique value adds
Different stakeholders are exploring how to optimize the benefits of increased field infrastructure, while avoiding the unintended complexity. One of these is increased anonymity for individual funders and therefore less transparency about who is funding whom, at what level, and what subtopics they are supporting.
This section of the report examines the perceptions and experiences of newer funders. It seeks to identify what is known and less apparent about their motivations and interests, and it explores the growing role of intermediaries in this developing ecosystem.
Rise of Authoritarianism Not the Only Driving Factor in Bringing Newer Funders to the Field
To understand the experiences and motivations of newer funders, and to compare these with perceptions held by legacy funders about newer funders, the survey asked parallel questions of each group. In many important areas, these perceptions differ from reality, leaving important opportunities for improving communication and understanding between groups.
Legacy funders’ perspectives on why new funders have entered the space and the barriers to entry they have faced differ from the experiences shared by newer funders. Nearly half of legacy funders (18 of 37) noted changes in the national political landscape — particularly factors related to the rise of authoritarianism in the U.S. — as the main driver for newer funders entering the space, while more than half (53 percent) cited political perceptions about the work as likely the main barrier to entry. By contrast, just 17 percent of newer funders (two of 12) cited authoritarianism as a motivation, and only 25 percent (three of 12) cited political perceptions as a barrier.
Though these gaps may be due to reluctance among respondents in sharing motivations that could be construed as political in nature, the motivations newer funders did share ultimately showed wider variety than the perceptions shared by legacy funders. In their survey responses, new funders cite varied reasons for entering the field, including concerns about attacks on democratic institutions more broadly, the interests and experience of new internal staff or leadership, along with Trump-related issues.
For Newer Funders, Relationships and Networking are Key
Legacy funders and new funders alike understand the importance of networking and connections for new entrants. When asked which factors helped most when they decided to start funding democracy work, 67 percent (eight of 12) of newer funders cited networks and connections as the most important. One newer funder noted in an interview that, after the chaotic “panic” of 2020 had subsided, they found that it became much easier to engage more meaningfully in the space as other field stakeholders have had more capacity to engage and welcome them.
Newer Field Funders Display Wide Range of Backgrounds and Interests
Newer field funders differ in their interests, engagements to date, and plans for the future. They approach their philanthropic giving from a range of lenses: an issue area lens, a geographic lens, a project approach lens, and a racial equity lens, among others. Several interviewees noted that some new funders make grant decisions based on the secondary impact that a stronger, more inclusive democracy could create. For instance, some democracy grants could help ensure clean energy investments are effectively implemented, and others could help foster thriving local economies. As one survey respondent described it, “There has been increasing awareness and alarm about the threats to our democracy and this has attracted new funders to the field — funders who are able to see how the health of our democracy underpins and connects to other issue areas.”
Given the breadth of approaches funders take, it is important not to view them as a single homogenous group. Instead, we looked at different new funder profiles to better understand their experiences, described below. These newer funders include both institutional funders and individual donors, generally with slightly different but overlapping motivations:
- Institutional funders — registered foundations with larger endowments and annual payouts and that are typically fully staffed. Many institutional funders have increased their annual grantmaking budget for democracy issues since 2016 and plan to maintain or increase funding in 2023–2024. A few others have shifted democracy grantmaking that was previously part of a temporary initiative or housed in a different portfolio area into a full, permanent program. Still others had never previously funded democracy-related activities but have recently turned toward this work as an entirely new focal area.
- Individual donors — who may have a registered foundation with little to no staff, or they may choose to give directly or through an intermediary such as a donor-advised fund. A number of high-net-worth individual donors recently entered the field, and stakeholders often note three key categories as being particularly prevalent: those with inherited wealth, wealthy executives from the finance world, and newly wealthy technology executives from Silicon Valley. Individual donors support work across the full spectrum of democracy sub-areas, although many have focused on funding democracy work with a technology, social entrepreneurship, and data-forward lens. While some individual donors may have established funding strategies, their giving also has been described as more nimble and responsive to their interest and needs of the moment. Some see individual donors as being more short-term focused.
Whether institutional funders or individual donors, many come to democracy issues from different backgrounds and motivations. Below are additional categories that can describe some of these newer field funders. These are based on survey responses from those who report having funded democracy-related causes for five years or fewer, qualitative discussions with stakeholders who regularly engage with and support newer field funders, and independent research. These categories are intended to be neither exhaustive nor mutually exclusive.
- Place-based funders — a number of typically local, state, or regionally focused funders have begun to support democracy efforts in their priority geographies, including work such as civic participation, voting rights, and local journalism. For instance, some groups funded census outreach and community organizing around redistricting during the 2020–2022 census and redistricting cycle. Some have even shifted to funding such work beyond their regional focus.
- Issue-based funders — those focused on one or more specific non-democracy issue areas, who have more recently come to democracy work as a lever for seeking impact on those issues. In some cases, this may be in response to decades of inaction and frustration, and a perception that new strategies must be considered (this is the case among many climate funders). In other cases, it may be in support of more acute needs in response to external policy changes or threats (such as among recent field entrants focused on protecting reproductive rights). For example, one newer funder who had previously focused primarily on social entrepreneurship and innovation explained that “everything we want to do requires the government to either enable it or to amplify it through scaling effective solutions, so we realized that democracy is critical to any progress.”
- Social justice funders — as the definition of democracy funding has broadened to include social and racial justice as prime focal areas, this has enabled longtime social justice funders to be brought more fully into democracy funding networks. Additionally, some funders deepened their social and racial justice work following the murder of George Floyd and in response to inequities that became more stark during the COVID-19 pandemic. In many cases, this deepening justice work included greater investment in initiatives on voting, elections, civil rights, and related issues alongside movement-building efforts.
- Political funders — those individual funders or organizations that have been major partisan donors or fundraisers to individual campaigns, PACs, and super PACs have more recently begun to engage in nonpartisan democracy work. For instance, Way to Win, a progressive political fundraising hub, recently established a 501(c)(3) grantmaking operation, Way to Rise, which has distributed over $5 million to state and local nonprofits working on co-governance, voter protection and education, and narrative change.
One funder shared their interpretation of growth and evolution of the field over this time period: “My mental model on funders in the last five years in the democracy space is that there were legacy funders (anyone in space before 2017); then there was a rush of funders who came in around 2017/2018; then there was another wave of funders who have come in in the last two to four years who had been dipping their toes in the water a little bit, but have now evolved to more stable funders in the space.”
Newer funders, especially individual donors, have much to offer the democracy field. These contributions bring new perspectives on sub-issues like misinformation and disinformation and media policy, the ability to experiment with entrepreneurial policy reform and interventions, and the ability to provide 501(c)(4) support. Funders moving into the democracy field from other areas also have a different set of expectations than do legacy funders, drawn from their experiences funding other fields. Moving forward, it is critical to determine the best strategies to leverage the strengths of an array of types of new funders in the field.
Number and Role of Funding Intermediaries Growing
As the democracy funding field has grown, the number of pooled funds, regranting organizations, and other intermediaries has also grown, bringing new benefits and challenges. Intermediaries play an increasingly significant role in managing and directing funding to democracy organizations. These vehicles have increased grantmaking convenience, effectiveness, and reporting for funders, and reduced administrative burdens for grantees. They also have served as critical low-barrier entry points for newer field funders. However, some stakeholders have noted that the increased number of intermediaries has caused some unnecessary complexity. At times, this has created difficulties for both newer and more legacy funders in navigating available options.
Growth in the number and scale of intermediaries is seen as a direct result of the growth of funding from individual donors, given the role of intermediaries as aggregators of funding across multiple donors as well as providers of confidentiality to the sources of funding. Evidence of the growth of funding intermediaries is largely drawn from publicly available information and reporting. It includes:
- Donor collaboratives and pooled funds are growing in size and number — In our research, Democracy Fund identified 74 funds and collaboratives for democracy-related work at the national level, half of which (41) launched in the years since 2016. Many of these include both 501(c)(3) and 501(c)(4) affiliates, making the full list of funds and organizations even larger, without even taking into account the numerous state and regional funds. Pre-existing funds continue to grow as well. For instance, 40 percent of all giving since 2010 from the State Infrastructure Fund ($56 million of $141 million) was raised during the 2020 election run-up. The Fund’s number of donors has also increased dramatically — from five institutional funders and individual donors in 2010 to 13 in 2017 to 41 as of July 2021. While difficult to estimate, it is likely many hundreds of millions of dollars flow through or are organized by these entities.
- Donor-advised funds have been a major source of funding growth — Of the $917 million that Silicon Valley Community Foundation’s donor-advised funds have distributed to democracy issues since 2011, over $541 million was donated during the 2019–2020 cycle. This aligns with exponential growth in giving to donor-advised funds more broadly — which has more than quintupled over the past decade — including in 2020, when major donor- advised fund sponsor Fidelity Charitable became the top recipient of charitable giving.
- Fiscal sponsors are growing in size — The Sixteen Thirty Fund, a major fiscal sponsor, experienced a tenfold increase in expenditures for consulting firm Arabella Advisors’ services from 2014 to 2019, signaling a large increase in the amount of funds flowing through the hub.
- Community foundations are increasing their democracy portfolios — Many regional community foundations have more recently focused on funding democracy work — both within their geographies and nationally — as donors have shown increasing interest in these areas. One interviewee described that their community foundation used to have a small grantmaking portfolio on democratic values, but expanded this focus in the wake of the 2016 election to support census work regionally, as well as national democracy organizations. Since then, it has found this work has helped attract new donors.
Intermediary Funder Benefits
Intermediaries function in different ways that may be attractive to potential funders. They serve as important entry points for newer field funders — narrowing and clarifying grantmaking options, making the complex field easier to navigate, and generally acting as a fund manager. Some of the value that intermediaries offer new funders includes, but is not limited to:
- Economies of scale — intermediaries provide a structure for giving in ways that individual foundations might not be able to pursue on their own. They have the ability to give a large number of small grants to organizations at the state and local level, which might otherwise pose administrative or relationship management difficulties for national foundations or those with small staffs. They also have both the scale and flexibility needed to be effective in rapid response situations. For instance, the Trusted Elections Fund was able to respond to security threats during the 2020 election, and the Fair Representation in Redistricting pooled fund swiftly provided needed support in response to legal and political developments across states during the 2020–2022 redistricting cycle.
- Amplified impact — pooling funds can mean that any individual funder can leverage their giving against that of others, amplifying impact while mitigating risk. Individual grantmakers can report to internal stakeholders about the accomplishments of the full fund, showing the role of their funding in helping achieve larger-scale impact. This can be helpful in unlocking even larger grantmaking budgets in the future. It can also enable program officers and directors to take on more risk than they would if they were operating alone, especially in newer democracy topics like electoral reform.
- Peer learning networks — intermediaries open doors to other funders, grantee organizations, field experts, and scholars, helping create peer networks and learning communities. These can be formal and informal processes of information exchange that newer funders or smaller foundations may not have capacity to manage on their own. This can be a particularly important benefit for newer funders seeking to build connections. These networks also provide infrastructure for identifying trends across funders, enabling intermediaries to create funding vehicles that are responsive to evolving interests.
- Tailored approaches — intermediaries are able to leverage the terminology, strategy, and approaches that the particular donors they serve feel most comfortable and aligned with. For instance, one interviewee at a funding intermediary explained how, because the vast majority of their fund’s donors are private equity investors, they approach their national coordination efforts like running a private equity or venture capital fund as an “activist investor.” Their team members sit on nonprofit boards, hold weekly check-in and briefing calls, and advise state campaigns and try to coordinate across states — all as strategies that their donors recognize and appreciate.
- Anonymity — funders who wish to remain unnamed for their philanthropic giving can achieve confidentiality by working with donor-advised funds, fiscal sponsors, community foundations, and other types of intermediaries. This is particularly relevant in the democracy space, where funders and grantees are often subject to threats of political violence and other risks.
Rapid Growth of Intermediaries Raises Perceived Tensions
Even with the long list of benefits that intermediaries offer, stakeholders also have noted concerns that rapid growth in the number and role of pooled funds and other intermediaries can create challenges. These can include:
- Complexity among intermediaries — while intermediaries are intended to help simplify options for donors, navigating the universe of intermediaries can prove challenging in itself. Some note the proliferation of funding vehicles with overlapping missions and foci can make it difficult especially for newer funders to parse differences and make strategic investment decisions.
- Perceived tensions with legacy approaches — where intermediaries serve a wave of newer field funders, often with approaches and interests different from those of legacy funders, intermediaries change their approaches to match. And pooled fund staff may have different backgrounds or expertise than other field funders, which may result in conflicting strategy. With the collective amount of funds these intermediaries administer growing significantly, these changes can alter overall field funding approaches, which has made some legacy funders wary.
- Competition drives misaligned incentives — intermediaries compete for funding from donors, and therefore may be incentivized to develop strategies and approaches that are inherently distinct from and, at times, in tension with those of other funds. This competitive landscape also requires funds to focus on proving impact. Some stakeholders have noted concerns over a growing emphasis on having grantees produce administratively burdensome quantitative impact data.
Broadly, intermediaries play the role of working across and with the heterogeneity of a field with a wide variety of funders. This is a major undertaking, and one that should not be taken lightly. In all, intermediaries present more benefits than concerns; however, they do introduce complexity to the field.
Looking Ahead
Impact, Opportunity, and the Value of Community Building
The constellation of foundations, donors, nonprofits, and grantees focused on the support and promotion of democracy in the U.S. has shifted significantly since 2016. The result is a field that has grown, matured, and become more impactful. The reasons for this dynamic growth are numerous and multifaceted. These include concerns over election interference, the rise of authoritarianism, growing polarization and division, the growing threat of misinformation, disinformation, and the troubling media landscape. Newer support spans that for engagement in the 2020 Census and ensuing redistricting, to election administration and protection efforts in the context of a global pandemic, to deepening efforts aimed at advancing social and racial justice in the wake of COVID-19 and the murder of George Floyd, and more.
For many, this period of transformation has raised significant questions about the future of the pro-democracy philanthropic field. Rapid growth in response to critical events and crises can just as easily be matched by rapid contraction particularly when it is perceived — correctly or incorrectly — that the crisis moment has passed. And early fundraising challenges experienced by grantees for nonpartisan work related to the 2023–2024 election cycle contributes to these concerns, despite our survey showing strong funding trends among institutional philanthropy. Growing pains can also take the form of inefficiencies, redundancies, and unnecessary complexity that can make a field less effective and blunt impact. Consequently, field stakeholders are wary.
Fortunately, stakeholders overwhelmingly share reasons for optimism: more funding and partners overall, a more mature and varied field, a more comprehensive understanding of how to bolster democracy for impact on a range of issues, and several critical recent examples of impact in spite of perceived challenges. Growth has created significant opportunities to expand and deepen important work in a host of areas — universally cited by survey respondents as cause for excitement about the field’s potential.
Only now, several years into this period of transition, can field stakeholders begin to understand the scope and impact of these changes, and to identify how best to capitalize on growth in ways that promote long-term field health, funding sustainability, and increased collective impact. And overwhelmingly, stakeholders agree: We must start with better information about what the field looks like today, and what we can expect for tomorrow. Stakeholders want to understand the diversity of the field, create collaborative environments, consider the sequencing of funding activities, and adopt strategies that reinforce one another. All are eager for more information that can help make sense of this new landscape, including the wealth of new opportunities it holds.
Potential Opportunities for Field Strengthening and Community Building
As the democracy field continues to grow and mature, additional needs have emerged to ensure that efforts to protect and strengthen American democracy are maximally effective. Opportunities include:
- Community building — several formal initiatives foster community in the democracy space — networks like Democracy Funders Network and the Funders Committee for Civic Participation as well as pooled funds and associated programming. However, funder experiences may vary, and some stakeholders have noted that well-known funders may have a more welcoming experience entering the field than smaller, lesser-known funders. Regardless, there is space to help funders better connect, to strengthen entry points for newer funders, and to build a strong identity for and community of “democracy funders.”
- Understanding grantee experiences — it will also be critical to engage with grantee organizations to understand their needs and experiences and enable them to better communicate their goals and crystallize their strategies (e.g., short versus long term, offensive versus defensive) to funders. With so much rapid change in the funding landscape, the experience of grantee organizations and their engagement with the funding ecosystem has changed too, and it will be important to understand especially where new pain points exist. After all, funding in this space is in service of the work grantees do.
- Defining democracy work — though the available field research and array of publicly available funding strategies have grown significantly, further research is still needed to provide more clarity. This could include:
- Developing a detailed definition of U.S. democracy work that is shared by a broad set of field stakeholders, and that builds on and updates existing typologies
- Concise mapping of field actors and their foci, with a particular focus on mapping pooled funds and intermediaries, and their distinct purposes to help especially newer funders navigate the landscape
- Landscape research on individual high-net-worth donors to pro-democracy causes across the ideological spectrum, including their funding and foci as of 2023
- Landscaping research and communications on the “anti-democracy” space, including foci, major funders, and emerging trends
- Strengthening coordination — the field’s rapid growth and the need for both short-term, responsive funding strategies (such as ensuring the security of election administrators in 2020) and for long-term planning (such as supporting advocacy to enact ranked-choice voting in a certain number of states over the next decade) requires regular, precise coordination. Democracy organizations and funders could benefit from consistent, well-maintained coordination mechanisms, including coordination tables, convenings, and shared initiatives. More data is needed, but this could include some level of consolidation across pooled funds and grantees — such as ensuring that there is not an excess of pooled funds supporting a particular subfield.
- Identifying and filling gaps — funders largely agree that there are key subfields of democracy work that are significantly underfunded, namely election administration, combating misinformation and disinformation, and local journalism. Reasons for inadequate funding may vary but include lack of resources for funders or conception of the issue as being part of “democracy funding.” Creating consistent platforms to share information about new efforts and initiatives in these areas, alongside building theories of change (such as Press Forward), can ensure that these sub-issues continue to grow at an appropriate pace.
Conclusion
This report represents a critical step in providing a more comprehensive understanding of the shifting field of democracy philanthropy in the United States: where it has been, where it may be headed, and how funder perceptions and realities on the ground compare. Yet questions persist, and further research and data collection are no doubt needed. To continue to grow in a way that meets the needs of the field, this moment and beyond, will require that we first develop a better shared understanding of who we are as a community, and how best to grow together — newer funders and legacy funders alike.
Appendix
Methodology
The objectives of this research project were to map and better understand the field of pro-democracy funding. Specifically, this project sought to understand the following aspects of the democracy funding space:
- The magnitude of the field in terms of total funding per year
- Historical changes in the size of the field, particularly from 2017–2018 to 2021–2022 and into 2023–2024
- Expectations around whether current funding trends will continue and emerging trends in the field
- Trends in the subtopics being funded and areas that are underfunded
- Funder experiences, particularly those of new funders, in order to better grasp how anchor and legacy funders and existing intermediaries can pave the way for more funders to enter and/or maintain their philanthropic support for a healthy democracy
To achieve these objectives, we relied on a number of sources, including:
- Existing literature, including industry publications, field-level reports, journal articles, foundation websites, and media coverage
- Responses from surveys the team conducted among foundation leaders, foundations staff, and donor advisors
- Self-reported grant data from institutional funders
- Interviews with experts, intermediaries, and new funders in the field
- Grant data publicly available on Candid
- Confidential grant data from survey respondents who opted to share their data
Below, we list the process that the team followed and how these sources played a role in each phase.
Three Caveats to the Findings
- Sourcing of grant data: Because there are limited amounts of publicly available grant data for comparison, we placed a strong emphasis on sourcing that information directly from foundations. However, limited data from foundations meant that direct comparisons were more challenging.
- Response rates for self-reported data: Response rates to requests for self-reported data were moderate. As only 37 foundations provided an overall topline number for funding and 13 provided grant-level data, our findings may not fully represent trends in the field.
- Institutional funders and individual donors: Survey responses are from only institutional funders, not from individual donors. Given that institutional funders are more visible through their online presence, their reputation, and their time in the field, they were more accessible for purposes of this survey research. Individual donors tend to use funding methods that help maintain their anonymity, and they were therefore challenging to fully include in this research, aside from anecdotal data that we sourced through interviews with intermediaries. For this reason, it is possible that the magnitude and growth rate defined in the report are, to some extent, underestimated.
Because of the gaps in the information the team was able to access, the team relied on informed estimates to reach our conclusions about the size of the field and its growth since 2016.
Existing Literature
We identified and reviewed more than 40 articles, reports, and website pages about the pro-democracy field and funding landscape. This process was designed to provide an initial, high-level understanding about perceptions in this space, identify major funders and intermediaries to include in interviews and surveys, and develop hypotheses that guided the rest of this research process. These sources are cited in a later part of the Appendix.
Interviews with the Experts
While conducting the literature review, we sat down with 17 individuals to hear firsthand about their experience in the field. These include foundation leaders and staff, donor advisors, community foundation leaders and staff, and heads of pooled funds. The insights from these conversations helped inform the design of the surveys that were subsequently conducted.
Survey Data
We conducted two different surveys: one to foundation leaders and a separate one to foundation staff. The leaders and the staff surveys were sent to 144 institutional funders. The distribution list included those previously known to Democracy Fund as supporting democracy-related work along with several that are included in the Candid’s database of democracy-related grants.
- The leaders survey received 53 responses (38 percent response rate)
- The staff survey received 34 responses (24 percent response rate)
- Five additional foundations shared topline information via email, rather than completing the full survey; these were treated as survey responses
Many questions did not make answering mandatory, so the number of funders who responded to any individual question varies. For instance, while 70 funders completed some amount of one or more surveys, only 37 of these funders provided data on topline funding amounts for 2021–2022.
Based on anecdotal data and interview responses, nonresponses to the survey were often due to concerns about confidentiality and anonymity, and due to limited staff capacity.
Self-Reported Grant Data from Survey Respondents
The staff survey included a question asking respondents if they would be willing to share raw grant data that we could review more closely and to support more granular analyses. Twelve funders provided internal grant data in this way. This amounted to data on 2,403 grants across 12 funders, totaling $1.1 billion. To describe the breakdown of issues supported, we interpreted the purpose statements provided by the funders who submitted the data and hand-coded grants accordingly. This process is similar to that conducted by Candid staff for data included in Candid’s database; however, we believe the data gathered and coded by our team may be more up-to-date and exhaustive of democracy-related funding from these institutions, given that the funders themselves identified the relevant grants.
Given the small number of funders included in this sample, these grant data were used as a sample to validate findings and provide greater detail where appropriate, rather than as the basis for most findings.
Interviews with Newer Funders, Intermediaries, and Other Stakeholders
We met with 17 field stakeholders, including with newer funders and representatives of key intermediaries. During 45-minute interviews, we asked experts for their answers to the research questions of this report, describing the magnitude of the field, the directionality of the field, where most funding is flowing, where there are funding needs, what the experience of new funders looks like, and the role that intermediaries play in this space. Through this process, we compared the survey research findings to anecdotal evidence shared verbally during interviews, some of which validated the survey findings, and some of which added new information.
Candid Data
Data from Candid filled important gaps in our research where survey data were insufficient to answer the research questions. We accessed data on Candid on various occasions for various uses, for example:
- To identify a broad list of funders in the democracy space that helped shape the list of institutional funders to receive the survey
- To identify the potential size of funding in the field that was then adjusted with the error rate
- To assess how the Candid data compared to self-reported foundation data in 2017–2018 and 2021–2022 for the purposes of understanding potential differences in how these datasets measure funding and develop a potentially more accurate picture of field funding
Defining the Field
Democracy Fund worked with internal experts to develop a taxonomy of democracy-related funding for use in our survey. To do this, we first assessed current taxonomies, including that developed by Candid in 2015, which remains the most widely used and cited. We then developed potential updates to these definitions to better match our understanding of current field foci — with the goal of developing categories and groupings that would make intuitive sense to survey respondents, while maintaining comparability with Candid data and categories where possible. We then discussed these categories with several leading funders to further hone the definitions and groupings. The resulting taxonomy, which was provided to survey respondents, is below.
These definitions are intended to encompass different types of work within each area — including action-focused initiatives on the ground, organizing and advocacy efforts, and academic and research-focused work.
Voting and Elections
- Voting Rights: Supporting efforts to influence access, ability, and requirements to vote, including work on voting rights and voter ID requirements, and combating voter suppression efforts.
- Voter Education and Engagement: Supporting efforts to inform and engage voters or mobilize voters to register to vote or participate in elections.
- Election Administration: Supporting administration, policy, and/or reform efforts addressing voting systems and technologies; encouraging recruitment and training of a new generation of poll workers; and efforts to prevent election subversion.
- Campaign Finance: Supporting research and/or reform efforts related to the financing of campaigns.
- Redistricting: Supporting efforts to study and/or reform the redistricting process, including litigation.
Inclusion, Equity, and Justice
- Social and Racial Justice: Supporting efforts to create a multiracial, inclusive democracy; combat structural racism; enable movement, power-building, and leadership development in historically marginalized communities, particularly communities of color; and support social justice efforts more broadly.
- Social Cohesion and Polarization: Supporting efforts to create a shared sense of identity and purpose, promoting conversations around important issues within and/or across communities, and combating polarization.
- Political Violence and Anti-Hate: Supporting efforts to prevent or mitigate political violence by addressing extremism and hate, promoting community resilience, and responding to trauma (individual and collective).
Civic Education and Participation
- Civic Education and Leadership: Supporting non-election-related efforts to educate youth and the public about civic issues including the political process and governing institutions, as well as promoting diverse leadership development in public and civic life and capacity building for community leaders.
- Public and Issue-Based Participation: Supporting non-election-related organizing, engagement, volunteerism, action around the policymaking process, naturalization efforts among legal permanent residents, or community life broadly or around specific issue areas or with specific constituencies.
- Census: Supporting efforts to ensure a full and accurate census count, including policy and Get-Out-the-Count activities, and a timely and comprehensive release of the data.
Government Effectiveness and Democracy Protection
- Civil Rights/Liberties and Rule of Law: Supporting work around the protection of civil rights and liberties and individual rights embodied in the Constitution, as well as efforts to uphold the rule of law.
- Government Oversight and Reform: Supporting efforts to research and/or reform the government, and to improve performance and transparency overall and within each branch of government, including around budgeting and fiscal systems at all levels of government, and the courts.
Media and Information Ecosystem
- Journalism: Supporting a broad range of efforts to promote a healthy journalism ecosystem and support local journalism, including efforts to educate and train journalists, support for news programs, investigative journalism, and documentary media, and efforts to expand tools and resources available to and used by journalists.
- Media Policy and Mis/Disinformation: Supporting efforts related to media access, including work around media literacy and media justice, efforts to implement and/or reform media information policies such as related to freedom of expression and intellectual property, and efforts to track and combat mis- and disinformation.
General/Non-Issue Specific:
Supporting multi-issue or multidisciplinary efforts or organizations through general operating funds not tied to specific sub-issues.
Other Issues:
Supporting democracy-related activities in specific issue areas not included in other categories.
Estimating the Magnitude of the Field
To arrive at this report’s estimates for the size of the full field (based on the sample of funders included in Candid’s database for 2017–2018), we took the following steps:
- Understand Candid’s rate of undercounting — we compared the 2017–2018 self-reported funding levels from the confidential sample of 12 foundations for which data were available on background. This analysis showed that Candid data undercounted funding levels for these foundations by 34 percent on average.
- Adjust Candid data based on undercounting rate — we then collected all Candid data for 2017–2018 and adjusted these data using the 34 percent error rate to estimate a revised total funding level for 2017–2018.
- Estimate the size of the field in 2017–2018 — we combined these two datasets, using confidential internal data for foundations where available (assumed to be accurate) and adjusted Candid data for those where self-reported data were not available, to develop a full field magnitude in 2017–2018 of $5.2 billion.
- Estimate the growth rate from 2017–2018 to 2021–2022 — we compared real and estimated totals for 2017–2018 with self-reported funding totals for 2021–2022 provided by survey respondents (n = 37), to develop an estimated in-sample growth rate of 56 percent.
- Estimate the size of the field in 2021–2022 — assuming the growth rate was consistent across all funders included in Candid’s data for 2017–2018 (n = 9,144), we then applied that growth rate to the adjusted 2017–2018 data to develop an estimated total for 2021–2022 of $8.1 billion. We divided this number by two to approximate the annual size of the field at $4.1 billion (note: these numbers may not add due to rounding).
The methodology described above relies heavily on projections and estimates based on data from several years prior, given the limitations of comparable data from 2021–2022. As an alternative to this methodology, our team attempted to use data from Candid’s broader database as a proxy for data that appears missing from the dedicated democracy-related database. This included the following steps and findings:
- Understand the rate of undercounting from Candid’s broader database — we first compared self-reported funding totals drawn from our survey with “Democracy” and “Voter Rights” data for the same foundations from Candid’s broader database for 2021–2022. We found the Candid data in these categories undercounted funding among these institutions by about 39 percent — or rather than these categories are expected to only account for about 61 percent of all funding (for instance due to not including all relevant categories).
- Adjust Candid data based on undercounting rate — if we assume that rate to be consistent across all institutions with 2021–2022 funding for “Democracy” and “Voter Rights” in Candid’s database, that would yield an estimate of $5.7 billion in total field funding for 2021–2022. If instead we assume the Candid data captures 81 percent of true funding — half the difference as what was identified — that would yield an estimate of $4.7 billion in total field funding for 2021–2022.
Due to significant and opaque differences in categorization between the “Democracy” and “Voter Rights” categories and the broader and more tailored set of issues measured in our survey and in Candid’s dedicated democracy-related database, we chose not to include these estimates in our main report.
Citations from the Literature Review
The research team scraped the websites of six philanthropy and nonprofit sector publications and nine general news publications, as well as the websites of the 14 members of the Democracy Funders Collaborative. The team focused on materials relevant to funding for U.S. democracy, primarily within the last five years (since 2018). The sites and publications that the team searched are:
Philanthropy Sector Publications and Sites
- Inside Philanthropy
- The Chronicle of Philanthropy
- Stanford Social Innovation Review (SSIR)
- Nonprofit Quarterly
- The Bridgespan Group
- Websites of Democracy Funder Collaborative members
- Scholars Strategy Network
General Publication Sites
- The New York Times
- The Washington Post
- Politico
- Vox
- The Atlantic
- The Economist
- The Wall Street Journal
- Insider
- The New Yorker
Below is a list of the publicly available sources of 40+ articles, reports, and webpages used in the report literature review:
| Article Title |
Publication/Source |
Date |
|
Article Title
We the People: A Philanthropic Guide for Strengthening Democracy
|
Publication/Source
Democracy Fund and the Center for High-Impact Philanthropy at the University of Pennsylvania
|
Date
2019
|
|
Article Title
Democracy-Focused Philanthropy: Choosing Operating Models for Deeper Impact |
Publication/Source
Rockefeller Philanthropy Advisors
|
Date
December 2022
|
|
Article Title
Our Divided Nation: Is There a Role for Philanthropy in Renewing Democracy? |
Publication/Source
Kettering Foundation/Council on Foundations
|
Date
2019
|
|
Article Title
Democracy & Philanthropy: The Rockefeller Foundation and the American Experiment |
Publication/Source
The Rockefeller Foundation
|
Date
2013
|
|
Article Title
The Roadmap for Local News: An Emergent Approach to Meeting Civic Information Needs |
Publication/Source
MacArthur Foundation
|
Date
February 2023
|
|
Article Title
Slow and Steady Wins the Race: Ten Years of the State Infrastructure Fund |
Publication/Source
State Infrastructure Fund
|
Date
July 2021
|
|
Article Title
Philanthropy to Protect US Democracy |
Publication/Source
Stanford Social Innovation Review
|
Date
October 2022
|
|
Article Title
Voter Engagement Toolkit for Private Foundations |
Publication/Source
Council on Foundations
|
Date
April 2018
|
|
Article Title
Foundations, It’s Time to Give 1% of Your Assets to Fix Democracy |
Publication/Source
The Chronicle of Philanthropy
|
Date
December 2019
|
|
Article Title
Achieving Justice for All Should Command Philanthropy’s Attention in 2020 Elections |
Publication/Source
The Chronicle of Philanthropy
|
Date
December 2019
|
|
Article Title
Democracy and Civic Life: What Is the Long Game for Philanthropy? |
Publication/Source
Knight Foundation
|
Date
November 2020
|
|
Article Title
General Operating Proposal |
Publication/Source
Protect Democracy
|
Date
June 2022
|
|
Article Title
On Democracy and Authoritarianism |
Publication/Source
Protect Democracy
|
Date
No Date
|
|
Article Title
Donors Worry About a Cash Crunch for Voter Registration Groups |
Publication/Source
The New York Times
|
Date
September 2022
|
|
Article Title
This Group Has $100 Million and a Big Goal: To Fix America |
Publication/Source
The New York Times
|
Date
November 2022
|
|
Article Title
U-Va. is investing $100 million in saving democracy. Can it make a difference? |
Publication/Source
The Washington Post
|
Date
June 2021
|
|
Article Title
Philanthropy Needs New Strategies to Save American Democracy |
Publication/Source
Inside Philanthropy
|
Date
October 2022
|
|
Article Title
Democracy Frontlines Fund Realizes Transformative Philanthropy for Racial Justice |
Publication/Source
Stanford Social Innovation Review (SSIR)
|
Date
Fall 2021
|
|
Article Title
Foundations Focus Their Attentions on Saving Democracy |
Publication/Source
The Chronicle of Philanthropy
|
Date
January 2021
|
|
Article Title
Philanthropy Can Help Build a Thriving Democracy by Building Up Programs and Places That Fuel Civic Involvement |
Publication/Source
The Chronicle of Philanthropy
|
Date
January 2022
|
|
Article Title
Can Philanthropy Save Democracy? |
Publication/Source
The Chronicle of Philanthropy
|
Date
October 2019
|
|
Article Title
Foundations, the Solution to Our Democracy Deficit Lies in Plain Sight |
Publication/Source
The Chronicle of Philanthropy
|
Date
May 2021
|
|
Article Title
To Protect Democracy, Funders Must Look to the States |
Publication/Source
Inside Philanthropy
|
Date
March 2021
|
|
Article Title
Democracy Funders Are Forgetting About One of the Biggest Threats to Democracy |
Publication/Source
Inside Philanthropy
|
Date
February 2022
|
|
Article Title
The Emerging Field of Political Innovation |
Publication/Source
Stanford Social Innovation Review (SSIR)
|
Date
Spring 2023
|
|
Article Title
How Can Philanthropy Help Rehabilitate US Democracy? |
Publication/Source
Stanford Social Innovation Review (SSIR)
|
Date
January 2021
|
|
Article Title
Democrats ‘Charity’ Voter-Registration Scheme |
Publication/Source
The Wall Street Journal
|
Date
September 2022
|
|
Article Title
Mark Zuckerberg has donated $300 million to protect democracy despite Facebook’s record |
Publication/Source
Vox
|
Date
September 2020
|
|
Article Title
Inside Mind the Gap, the secretive Silicon Valley group that has funneled over $20 million to Democrats |
Publication/Source
Vox
|
Date
January 2020
|
|
Article Title
A new generation of philanthropists are ticked off at Trump — and their parents |
Publication/Source
Vox
|
Date
January 2020
|
|
Article Title
Publishing C.E.O. Donates $500,000 to Fight Book Bans |
Publication/Source
The New York Times
|
Date
February 2022
|
|
Article Title
The most powerful network of Democratic donors has a new president |
Publication/Source
Politico
|
Date
September 2021
|
|
Article Title
Dems fear for democracy. Their big donors aren’t funding one of its main election groups |
Publication/Source
Politico
|
Date
February 2022
|
|
Article Title
Philanthropy’s Agenda for Rebuilding Our Democracy |
Publication/Source
The Chronicle of Philanthropy
|
Date
November 2020
|
|
Article Title
Philanthropy’s Stimulus Plan Must Bolster Democracy |
Publication/Source
The Chronicle of Philanthropy
|
Date
April 2020
|
|
Article Title
Everything Philanthropy Cares About Depends on a Strong Democracy. Here’s What We Can Do to Stop the Deterioration |
Publication/Source
The Chronicle of Philanthropy
|
Date
October 2019
|
|
Article Title
116 Organizations Driving Change |
Publication/Source
Medium
|
Date
July 2020
|
|
Article Title
Civic Engagement Grants |
Publication/Source
Inside Philanthropy
|
Date
No Date
|
Overview of Survey Respondents
Funders who responded to the survey(s) reported annual democracy grantmaking budgets ranging from $902,000 per year to over $610 million annually and included both newer (less than five years in the field) and older (more than five years in the field) funders. The vast majority of respondents had funded democracy issues continuously for more than five years, and a plurality of respondents provided over $20 million in grants to democracy issues in 2021 2022.
Funders by 2021–2022 501(C)(3) Grantmaking Total
|
| 2021–2022 501(c)(3) Grantmaking Total |
Number of Funders in the Survey Sample Within Range |
Total Dollar Amount Given by Funders in this Category |
|
2021–2022 501(c)(3) Grantmaking Total
$50 million
|
Number of Funders in the Survey Sample Within Range
8
|
Total Dollar Amount Given by Funders in this Category
$1,269,966,482
|
|
2021–2022 501(c)(3) Grantmaking Total
$20 million to $50 million
|
Number of Funders in the Survey Sample Within Range
8
|
Total Dollar Amount Given by Funders in this Category
$229,516,645
|
|
2021–2022 501(c)(3) Grantmaking Total
$10 million to $20 million
|
Number of Funders in the Survey Sample Within Range
8
|
Total Dollar Amount Given by Funders in this Category
$125,834,500
|
|
2021–2022 501(c)(3) Grantmaking Total
$5 million to $10 million
|
Number of Funders in the Survey Sample Within Range
5
|
Total Dollar Amount Given by Funders in this Category
$40,767,500
|
|
2021–2022 501(c)(3) Grantmaking Total
$5 million
|
Number of Funders in the Survey Sample Within Range
8
|
Total Dollar Amount Given by Funders in this Category
$16,837,000
|