Press Release

NEW REPORTS: Democrats Were Divided in 2016 and 13 Percent of Partisans Have Changed Parties

Democracy Fund
/
December 14, 2017

Working Class and Elite Democrats Were Divided on 2016 Priorities and 13 Percent of Partisans Have Changed Their Party in the Last Five Years

Democracy Fund Voter Study Group analyses suggest that Trump won swing voters who cared most about economic issues and that the majority of Obama-to-Trump voters now identify as Republicans

Washington, D.C. – December 14, 2017

The Democracy Fund Voter Study Group, a research collaboration of leading analysts and scholars from across the political spectrum, has released two new papers about the 2016 election and its ongoing impact on the parties: Both papers are based on the Democracy Fund Voter Study Group’s unique longitudinal data set, which began measuring voters’ opinions and affinities in 2011 and continued through, most recently, July 2017. In Party Hoppers: Understanding Voters Who Switched Partisan Affiliation, Robert Griffin, Associate Director of Research at PRRI, explored partisan switching — individuals leaving their party to become independents or join the opposite party. Griffin found that, while the overall numbers of Democrats and Republicans appear stable, a significant number (13 percent) of partisans have changed their affiliation in the last five years. Other key findings include:

“While party identification is typically seen as pretty stable, a significant number of partisans have switched their affiliation in the last five years,” said Griffin, Associate Director of Research at PRRI, “These changes reflect shifts we observed in 2016 and suggest that the election will have a long-term impact on the electorate.”

  1. Democratic non-college whites and Republican people of color were likeliest to leave their party. People of color and those under 45 were among the likeliest to switch from the Republican Party, while Democrats have lost non-college white voters and those over 45.
  2. A majority of Obama-to-Trump voters now identify as Republicans. While most Obama-Trump voters once identified as Democrats, a majority now identify as Republicans. Since 2011, there has been a 28 percent decline in Democratic identification and a 43 percent increase in Republican identification among these voters.
  3. Obama-to-third-party voters are likely to identify as Independents. Among those who voted for Obama in 2012 and then a third-party candidate in 2016, Democratic identification has dropped 35 percent while independent identification has risen 37 percent.
  4. Immigration attitudes, ideological self-identification, and economic views were the most influential issues in party-switching. Switching from the Republican Party was most strongly associated with positive attitudes about immigration, self-identification as more ideologically liberal, and more liberal economic views. Leaving the Democratic Party was most strongly associated with negative attitudes about immigration, unfavorable attitudes towards Muslims, self-identification as more ideologically conservative, more conservative economic views, and lower levels of economic anxiety.

In Placing Priority: How Issues Mattered More than Demographics in the 2016 Election, David Winston used a cluster analysis of 23 different issues to group voters into meaningful segments with clear priorities and belief systems that translate into party preference, ideological choice, and voting decisions. Key findings include:
“This research shows that issues can be used to cluster voters into meaningful segments with clear belief systems that translate into voting decisions,” said David Winston, President of The Winston Group. “In the future, both political parties need to recognize that the electorate has a clear set of priorities. Issues matter – and going forward, they may matter more than demographics.”

  1. Democratic/Independent Liberal Elites and the Democrat-Leaning Working Class had different priorities. The “Democrat/Independent Liberal Elites” cluster prioritized issues popular in the media coverage of the election, including gender and racial injustice, but not issues that were “very important” to the other Democratic cluster and the country as a whole, such as the economy and jobs.
  2. Donald Trump won more of the top ten prioritized issues, including the economy, jobs, crime, and terrorism, while Clinton won the majority of the 23 issues included in the survey. However, the issues she won were lower prioritized, and they included five of the bottom six issues.
  3. Swing voters were not satisfied with the status quo when it came to the economy. The contrast of change versus status quo moved swing voters closer to Republicans, based on issue priorities centered around economic issues. This was particularly true in the Rust Belt, where the election was decided.

“Rob’s and David’s analyses help us better understand what ideas and information influenced and motivated voters’ choices when they went to the polls in 2016,” said Henry Olsen, Senior Fellow at the Ethics and Public Policy Center and Project Director for the Democracy Fund Voter Study Group. “Clear data about what moved voters in 2016 can help us better understand the dynamics shaping voter opinions in upcoming elections.”

In the coming months, the Democracy Fund Voter Study Group will be releasing a number of in-depth reports and data sets exploring public opinion on trade, immigration, democracy, and millennials, among other topics. Most recently, the group of experts commissioned the July 2017 VOTER Survey (Views of the Electorate Research Survey) of 5,000 adults who had participated in similar surveys in 2016, 2011, and 2012. The Voter Study Group will put a third survey into the field in early 2018.

Please sign up for email alerts here. The 2016 and 2017 VOTER Surveys and reports were made possible by a grant from Democracy Fund to the Ethics and Public Policy Center to conduct new research about changing trends among the American electorate.

VOTER Survey Methodology Summary

In partnership with the survey firm YouGov, the Democracy Fund Voter Study Group commissioned the 2016 VOTER Survey (Views of the Electorate Research Survey) of 8,000 adults who had participated in similar surveys in 2011 and 2012. The Voter Study Group then interviewed 5,000 of the same respondents between July 13-24, 2017 to explore how voters’ opinions may have changed—or how they did not change at all. A complete 2017 survey methodology is available here.

About the Ethics and Public Policy Center (EPPC)

Founded in 1976 by Dr. Ernest W. Lefever, the Ethics and Public Policy Center is Washington, D.C.’s premier institute dedicated to applying the Judeo-Christian moral tradition to critical issues of public policy. From the Cold War to the war on terrorism, from disputes over the role of religion in public life to battles over the nature of the family, EPPC and its scholars have consistently sought to defend and promote our nation’s founding principles—respect for the inherent dignity of the human person, individual freedom and responsibility, justice, the rule of law, and limited government.

About the Democracy Fund

The Democracy Fund is a bipartisan foundation created by eBay founder and philanthropist Pierre Omidyar to help ensure that our political system can withstand new challenges and deliver on its promise to the American people. Since 2011, Democracy Fund has invested more than $70 million in support of a healthy democracy, including modern elections, effective governance, and a vibrant public square.

Blog

Competent Poll Workers Bolstered Voters’ Confidence in 2016

Jack Santucci
/
November 1, 2017

What makes Americans trust the electoral process? How can Democracy Fund work to build trust? We spend a lot of time thinking about these issues, since trust in elections and institutions more broadly are essential to healthy democracy. In order to inform our work on trust and election administration, we partnered with Reed College and the 2016 Cooperative Congressional Election Study.*

Our survey of 1,000 Americans turned up two important results in the ‘trust’ framework. First, confidence in vote-counting depends in part on who wins or loses. At the same time, competent poll workers may help bolster voters’ trust in elections.

One way to measure trust in elections is to ask respondents about “voter confidence” – a measure of whether people feel confident that their own ballots were (or will be) counted as intended. (You can read about other measures here.) In order to help us find correlates of change, we asked about voter confidence both pre- and post-election.

Winner’s and loser’s effects

The table below reveals clear evidence of what political scientists call the winner’s effect. As far as we know, this is a psychological boost from seeing a preferred candidate win. Going into the election, only 65.9 percent of Trump supporters were “very” or “somewhat confident” that their votes would be counted as intended. Post-election, that changed to 93.2 percent — an increase of 27 points.

Other studies point to a loser’s effect. We did not find much of one in 2016. 86.3 percent of Clinton voters reported being “very” or “somewhat confident” after the election, a decline of only four points.

Graph: Candidate Success May Influence Voter Confidence

The importance of competent poll workers

We also found that people who rated their poll workers highly tended to express higher confidence. For example, 62 percent of respondents rated their poll workers as “excellent,” and 63.4 percent of those people were “very confident” in the counting of their votes.

Going a step further, we used logistic regression to test the relationship between the polling-place experience and change in one’s voter confidence. This analysis also accounted for age, race, gender, education, income, and vote choice.

On average, respondents who said their poll workers did an “excellent job” were less likely to report lower confidence post-election than those who said “poor job” – 4.5 times less likely among Trump voters and 2.5 times less likely for Clinton voters.

What made people rate poll workers highly? One factor stood out in our data: a perception that poll workers “knew the proper procedures.” 60.7 percent of respondents who reported that perception also said they were “very confident” that their votes had been counted as intended. This relationship held in a logistic regression controlling for age, race, gender, education, income, vote choice, and a raft of other potential reasons for rating poll workers highly (e.g., politeness, tending to voters waiting in line, et cetera).

Given the prevalence in 2016 of rhetoric about “hacking” and “rigging” —as well as other, more specific worries across partisan and racial groups—we were pleased to find that competent poll workers likely boost trust.

Based on analysis captured in our Elections & Public Trust systems map, Democracy Fund supports several organizations working on ways to raise the quality of election administration and improve the voter experience at polling places. The Caltech/MIT Voting Technology Project, for example, offers a set of tools that election officials can use to reduce voter wait times and efficiently allocate polling-place resources. Other good examples come from the Center for Civic Design, which provides election officials with field guides that, among other things, include instructions on providing clear materials for poll worker training and making in-person voting a pleasant experience.

We hope these data and the good work being done by these and other grantees spark a larger conversation about the importance of recruiting and training poll workers. Americans rely on poll workers to understand and help voters navigate election processes. To further promote trust in elections, election officials and advocates can and should continue to support poll workers’ success.

This is the second in a series of blog posts that showcase our findings from the CCES, and we look forward to sharing more in the coming months. This post was first published in November 2017, and was updated in February 2018.

✩✩✩

* YouGov administers the Cooperative Congressional Election Study (CCES), which includes Common Content and invites participation from up to 50 academic teams. The Reed/Democracy Fund pre-election survey was administered to 1,000 respondents, and our post-election data includes answers from 845 respondents. More information about the CCES and its methodology is available at the Harvard Dataverse, found at: https://cces.gov.harvard.edu/data.

Paul Gronke is the Principal Investigator of the Reed College/Democracy Fund team module. Natalie Adona is the Research Associate for the Democracy Fund’s Elections Program and manages the roll-out of these findings, with support from Jack Santucci, the Elections Research Fellow. Please direct any questions about these survey findings to nadona@democracyfund.org.

Blog

Is Social Media a Threat to Democracy?

/
October 4, 2017

Today The Omidyar Group released a paper co-authored by me and two colleagues at Omidyar Network on the role of social media platforms on democracy and the public square. This paper – called “Is Social Media a Threat to Democracy?” – comes at a moment when there is new scrutiny on the role Facebook, Google, and Twitter played in spreading misinformation and divisive propaganda during the 2016 election. Those debates loom large, however, our analysis goes well beyond any one election to try and understand how social platforms are disrupting core elements of a democratic society.

In June 2017 Facebook raised the question “Is social media good for democracy?” Like them, we have been wrestling with these questions for some time, and while we do not take for granted how these networks provide value to civic life, we are also deeply troubled by the dangers they pose. Their algorithms and their vast storehouses of data gives them fundamentally new capacities abilities to shape discourse, media, and civic and democratic life in American.

As my co-authors – Stacy Donohue and Anamitra Deb – and I reviewed the research of leading voices on this set of issues, we identified six key ways social media is threatening democracy:

  • Exacerbating the polarization of civil society via echo chambers and filter bubbles
  • Rapidly spreading mis- and dis-information and amplifying the populist and illiberal wave across the globe
  • Creating competing realities driven by their algorithms’ intertwining of popularity and legitimacy
  • Being vulnerable to political capture and voter manipulation through enabling malevolent actors to spread dis-information and covertly influence public opinion
  • Capturing unprecedented amounts of data that can be used to manipulate user behavior
  • Facilitating hate speech, public humiliation, and the targeted marginalization of disadvantaged or minority voices

There are no easy answers to the challenges represented above, and any group of potential solutions must account for the diverse interests of multiple stakeholders if we are going to have the public square we deserve. As our founder, ebay creator Pierre Omidyar, wrote today in The Washington Post, “Just as new regulations and policies had to be established for the evolving online commerce sector, social media companies must now help navigate the serious threats posed by their platforms and help lead the development and enforcement of clear industry safeguards. Change won’t happen overnight, and these issues will require ongoing examination, collaboration and vigilance to effectively turn the tide.”

For our part, at Democracy Fund, the potential effects of social media on democracy are closely tied to many lines of our work. This includes longstanding investments on issues ranging from combating hyperpartisanship with constructive dialogue to developing digital election administration tools, and from understanding the impact of fact checking to supporting communities often targeted online. A few examples of this work include:

  • Politifact, one of the nation’s leading fact checking organizations, has partnered with Facebook to combat the spread of misinformation on the platform.
  • The Center for Media Engagement, formerly the Engaging News Project, works with newsrooms, social platforms and the public to develop and test ways to make trusted online information more engaging and impactful.
  • The Coral Project builds open-source tools focused on helping newsrooms build safe, secure and vibrant online communities.

In addition, we supported the Knight Prototype Fund on misinformation earlier this year, which focused on many of these issues. The full list of 20 projects can be found here, but the four projects we funded are:

  • Viz Lab — Developing a dashboard to track how misinformation spreads through images and memes to aid journalists and researchers in understanding the origins of the image, its promoters, and where it might have been altered and then redistributed across social media.
  • Hoaxy Bot-o-Meter is a tool created by computer scientists at the Center for Complex Networks to uncover attempts to use Internet bots to boost the spread of misinformation and shape public opinion. The tool aims to reveal how this information is generated and broadcasted, how it becomes viral, its overall reach, and how it competes with accurate information for placement on user feeds.
  • The Documenters Project by City Bureau creates a network of citizen “documenters” who receive training in the use of journalistic ethics and tools, attend public civic events, and produce trustworthy reports on social media platforms.
  • The American Library Association is collaborating with the Center for News Literacy to develop an adult media literacy program in five public libraries, focused on how to be a savvy digital citizen in a platform world.

We are going to continue to ask hard questions and support people and organizations who are working to create a robust public square that serves our democracy. We look forward to continuing this work alongside these and other partners. Please email the authors at inquiries@omidyargroup.com if you’d like to discuss how we might work together.

Blog

Sneak Peek: New Data on What Americans Think About Voter Registration

Natalie Adona
/
September 22, 2017

In 2016, the Democracy Fund participated in the Cooperative Congressional Election Study (CCES) in partnership with Reed College. (1) Through this partnership, we sought to gain a better understanding of public opinion about election administration and voting, use the data to inform Democracy Fund’s strategic priorities, and add to the growing body of knowledge in election policy. The Reed/Democracy Fund module, which was administered pre- and post-election, includes several questions, grouped in the following categories:

  • Voting behavior and the voter experience;
  • Election administration;
  • Election integrity, fairness, and trust; and
  • Policy preferences.

As National Voter Registration Day approaches, I’d like to offer a preview and some initial thoughts about our findings—specifically, those covering certain aspects of the registration process. As I explain below, our findings suggest that voters need ongoing education to understand key aspects of the voter registration process. The data also suggest that election officials are well positioned to provide clear, easy-to-understand information about registration and to continue educating the public about the availability and benefits of online voter registration.

Public perceptions of the voter registration process

States have a long history of requiring registration before a person may vote. However, voters and potential voters might not be completely familiar with, and may even be confused by, certain aspects of the process. Missing the state registration deadline or experiencing a significant life change like a marriage or a move without updating registration can lead to a person being unable to cast a valid ballot.

In our survey, we asked participants about some key aspects of the registration process so that we could better understand and then address potential gaps in voter education. Because it’s available in 35 states and DC, and is a relatively recent change in election policy, we included questions about respondent’s knowledge and use of online voter registration (OVR). (2) We also wanted to know whether people understand when to update their registration and how respondents find out about voter registration deadlines.

1) Knowledge and use of OVR

When asked about whether their states offer OVR, about 51 percent of respondents did not know. Over 17 percent answered incorrectly; of those respondents, 56 percent believed that their state did not offer OVR, and 44 percent believed that the state does offer it. (3) Of the third of respondents who provided the correct answer and had access to OVR, over 60 percent of them had not registered or updated their registration using the state’s online system.

At first glance, these data may be discouraging and reflect the need for stronger efforts to educate voters about the availability and benefits of OVR. There are, however, some caveats to these results that prompt the need for further study:

  • Many respondents were already registered. Almost 86 percent of CCES respondents answered that they were registered to vote. Though questions of this type are sometimes susceptible to social desirability bias, we assume that CCES respondents answered truthfully, and might not have had the need to use OVR at the time they completed the survey. So, while we encourage states to offer OVR to their citizens, some groups of voters may not use it for several years.
  • Some respondents prefer the paper form. While 49 percent of respondents answered that they would prefer to use OVR, 35 percent indicated that they preferred a paper form. It is unclear whether those answers reflect a lack of trust in using OVR or were motivated by some other reasons. However, these data make it clear that states should not completely phase out paper—at least, not while a significant number of people prefer paper or lack access to the Internet.
  • Some respondents may have been registered at DMV. Even though the CCES does not ask about the manner in which respondents registered to vote, we assume that some may have registered through their state department of motor vehicles (DMV). Data from the United States Election Assistance Commission shows that, between 2014 and 2016, election officials received 33 percent of registrations from DMVs, which is the largest single source of registration applications compared to in person (12 percent), by mail (17 percent), online (17 percent), and other sources (15 percent).

2) Updating registration upon moving

Most respondents knew that they need to register or update their registration after a move; however, a significant percentage of people did not. To challenge our respondents on the basics of registration, we presented them with various scenarios that may trigger registration updates, e.g., moves across town, other counties, or other states.

There were varied responses to our scenarios about moving. While most of our respondents understood that a move to another state requires them to change registration, 46 percent of respondents either did not know or said “no” when asked if an across-town move triggers this need. Nearly 30 percent of respondents answered incorrectly when asked about an out-of-county move, and about 23 percent erroneously thought that they did not need to re-register after an out-of-state move.

We do not yet know what role the DMV might play in shaping the public’s understanding of the registration process, and whether DMV interactions may explain the difference in these responses, if at all. Given the large percentage of people who register through DMVs, we look forward to using these CCES findings as a jumping off point for future analysis.

3) Finding voter registration deadlines

When asked about the top three resources that they turn to for voter registration deadlines, about 70 percent of our respondents said that they rely on their county election website; about as many rely on their state’s election website for the same information. Over 60 percent of respondents also use search engines like Google to look up voter registration deadlines—and very likely receive reliable information from the states, thanks to our friends at the Voting Information Project.

In contrast, relatively fewer respondents get information from other sources such as campaigns or friends and family. There may be a chance that some respondents chose these government websites as socially acceptable alternatives to admitting that they rely on other sources for registration information. But if it’s true that voters prefer the county or state website, then election officials have significant influence over how people understand voter registration requirements.

The need for voter education

From this snapshot of our findings, the need for information about key aspects of voter registration is clear. The good news is, state and local election administrators are well positioned to educate voters about these aspects of the voter registration process and to communicate the availability and benefits of OVR. As the data indicates, voters pay attention to information from state and local election officials and would benefit from existing voter outreach and educational services.

However, simply building a website and expecting people to use it is not enough—ongoing voter education is needed to keep voters up to speed with voter registration processes and deadlines. Fortunately, election officials are not alone in this effort. Events like National Voter Registration Day are a wonderful opportunity for election officials, advocates, and community-based groups to engage with voters and potential voters, offer up-to-date information about the registration process, and provide the tools and resources that voters need to complete their registration forms and keep them updated—and well in advance of the next election.

This is the first in a series of blog posts that showcase our findings from the CCES. We look forward to sharing more in the coming months.

This blog was updated February 2018. It was first published in September 2017.


Sources

(1) The Cooperative Congressional Election Study is a survey administered by YouGov that includes Common Content and invites participation from up to 50 academic teams The Reed/Democracy Fund pre-election survey was administered to 1000 respondents, and our post-election survey includes answers from 845 respondents. More information about the CCES and its methodology is available at the Harvard Dataverse, found at: https://cces.gov.harvard.edu/data.

Paul Gronke is the Principal Investigator of the Reed College/Democracy Fund team module. Natalie Adona is the Research Associate for the Democracy Fund’s Elections Program and manages the roll out of these findings, with support from Jack Santucci, the Elections Research Fellow. Please direct any questions about these survey findings to nadona@democracyfund.org.

(2) Though 38 states and DC have authorized online voter registration, 3 states have yet to implement it. See “Online Voter Registration,” from the National Conference of State Legislatures, updated September 11, 2017. Available at: http://www.ncsl.org/research/elections-and-campaigns/electronic-or-online-voter-registration.aspx.

(3) Data on states with online voter registration as of the 2016 primary elections come from the National Conference of State Legislatures (see source #2).

Press Release

Voter Study Group Releases New Poll of 5,000 Voters on First Six Months of the Trump Administration

Democracy Fund
/
September 6, 2017

Longitudinal survey finds the highest regret among Obama-to-Trump voters, strong opposition to two top Trump priorities, and sharp partisan shifts in views about the nation’s direction

Washington, D.C. – September 6, 2017 – The Democracy Fund Voter Study Group, a research collaboration comprised of leading analysts and scholars from across the political spectrum, has released initial findings from its July survey, which tested how Americans are reacting to President Donald Trump’s first six months in office. Notably, most voters do not regret the decision they made in the 2016 election. However, Obama-to-Trump voters are the most likely to regret the choice they made last November and are more likely than other Trump voters to disapprove of the President’s performance.

The data also illuminate how voting Americans are strongly opposed to two hallmarks of President Trump’s campaign. Both repealing the Affordable Care Act and building a wall along the border of Mexico have greater opposition than support among the 5,000 voters polled, while other Trump campaign promises included in the poll continue to enjoy support.

These and other findings are described in a new memo, “The First Six Months: How Americans are Reacting to the Trump Administration,” authored by Robert Griffin, a member of the Voter Study Group and Director of Quantitative Analysis at the Center for American Progress.

“Voters’ opinions have been incredibly stable considering the tumultuous nature of this Administration’s early months,” said Griffin. “Trump has mostly held onto the support of those who voted for him in November. The one exception has been the much-discussed Obama-to-Trump voters – more than one in five now disapprove of the President.”

“Our results show how public opinion remains supportive of some of the President’s key campaign promises,” said Karlyn Bowman, a Voter Study Group editor and Senior Fellow at the American Enterprise Institute. “But as the immigration debate and budget negotiations heat up, building a wall remains especially unpopular, and as NAFTA negotiations get underway, the data show attitudes toward trade becoming more positive.”

Further findings relevant to the President’s agenda and detailed in “The First Six Months” include:

  1. Trump voters still support the President, but support is weaker among Obama-Trump voters: Eighty-eight percent of Trump voters still approve of the President while just nine percent disapprove. Unsurprisingly, the vast majority of Clinton voters (96 percent) disapprove of Trump. Among Obama-Trump voters, 70 percent approve, but 22 percent disapprove – a rate twice as high as that of all Trump voters.
  2. Few voters regret the choices they made in 2016, but Obama-Trump voters are unusually likely to regret their vote: Sixteen percent of Obama-Trump voters regret voting for Trump—the highest of any group examined.
  3. Democrats have an early edge in the 2018 midterms because of uncertainty and defection among Trump voters: In line with other July polls, the Democrat Party has a seven-point lead over Republicans in the “generic ballot” question – 43 percent to 36 percent. This lead is largely created by the nearly unanimous support of Clinton voters for Democrats combined with about 20 percent of Trump voters who say they will vote for a third-party candidate, are uncertain of their vote, or will not vote.
  4. Strong opposition outweighs strong support on two of the President’s highest campaign priorities: Of the campaign promises included in the survey, there are two where strong opposition outweighs strong support, and they happen to be two of the President’s top priorities: ACA repeal and building the border wall. On every other campaign promise polled, strong support is higher than the opposition.
  5. Despite a tumultuous six months, many other attitudes remain stable—with two exceptions: Of the topics included in the poll, there are only two issues where opinion appears to have changed significantly from December 2016 to July 2017: First, there was a 13-point increase in the percentage of respondents who favored increasing trade with other nations. Second, support for a temporary Muslim immigration ban increased from 44 percent to 47 percent.
  6. Americans’ views about the direction of the country and its prospects have shifted sharply along partisan lines: Clinton voters generally felt worse about their quality of life as well as the nation’s economic and political standing. At the same time, Trump voters have become much more optimistic across six measures.
  7. Americans generally have a negative opinion of Vladimir Putin, but dislike the person they didn’t vote for even more: Americans now dislike the opposing 2016 presidential candidate more than an authoritarian leader widely-believed to have meddled in the election. Both Clinton and Trump voters dislike the candidate they didn’t vote for more than they do Putin.

More data on these findings, along with accompanying infographics, are available here.

In the coming weeks and months, the Democracy Fund Voter Study Group will be releasing a number of in-depth reports exploring trends across the longitudinal surveys, which polled a panel of Americans in 2011, 2012, 2016, and now 2017. Coming analysis will cover evolving public opinion on health care, trade, immigration, democracy, and millennials, among other topics.

The Democracy Fund Voter Study Group is a politically-diverse group of conservative, progressive, and independent experts who came together in 2016 to study the American electorate. The research of the Democracy Fund Voter Study Group is designed to help policy makers and thought leaders listen more closely, and respond more powerfully, to the views of American voters.

The 2016 and 2017 VOTER Surveys and reports were made possible by a grant from Democracy Fund to the Ethics and Public Policy Center to conduct new research about changing trends among the American electorate.

_________________________________________________

VOTER Survey Methodology Summary

In partnership with the survey firm YouGov, the Democracy Fund Voter Study Group commissioned the 2016 VOTER Survey (Views of the Electorate Research Survey) of 8,000 adults who had participated in similar surveys in 2011 and 2012. The Voter Study Group then interviewed 5,000 of the same respondents between July 13-24, 2017 to explore how voters’ opinions may have changed—or how they did not change at all. A complete 2017 survey methodology is available here.

About the Ethics and Public Policy Center (EPPC)

Founded in 1976 by Dr. Ernest W. Lefever, the Ethics and Public Policy Center is Washington, D.C.’s premier institute dedicated to applying the Judeo-Christian moral tradition to critical issues of public policy. From the Cold War to the war on terrorism, from disputes over the role of religion in public life to battles over the nature of the family, EPPC and its scholars have consistently sought to defend and promote our nation’s founding principles—respect for the inherent dignity of the human person, individual freedom and responsibility, justice, the rule of law, and limited government.

About the Democracy Fund

The Democracy Fund is a bipartisan foundation created by eBay founder and philanthropist Pierre Omidyar to help ensure that our political system can withstand new challenges and deliver on its promise to the American people. Since 2011, Democracy Fund has invested more than $60 million in support of a healthy democracy, including modern elections, effective governance, and a vibrant public square.

Blog

Understanding Trust to Strengthen Democracy

/
August 21, 2017

This blog was co-authored by Francesca Mazzola, Associate Director at FSG.

Three Important Lessons About Trust

At Democracy Fund, we have been exploring questions of trust. Trust in institutions is at an all-time low. In 2016, for example, only 32% of Americans said they had a “Great Deal” or “Fair Amount of Trust” in mass media, the lowest level of trust in Gallup polling history.

Meanwhile, research suggests (1) that higher levels of trust lead to: a) greater confidence in trusted individuals or institutions and b) a willingness to act based on that confidence. In the context of our national relationship to the news media, for instance, this implies that a significant majority of Americans may not be willing to act civically or otherwise based on the information provided by mass media outlets.

Given that democracies function best when individuals participate in the civic process (e.g. voting, running for office, volunteering), it is clear that the current low level of trust in public institutions (including, but not only, the media) is a problem in need of attention. A healthy democracy requires institutions that are both trustworthy and trusted.

As we’ve been investigating the notion of trust, three important lessons have become apparent to us:

1. Trust has both cognitive and affective dimensions

Think about someone you trust. Now think about the reasons why you trust that person. More than likely, they have a good “track record” of having been there for you when you needed them. In addition, you probably have an emotional bond with them that allows you to be vulnerable. This exemplifies the two dimensions of trust – cognitive and affective. (2)

Cognitive trust has been described as “trusting from the head.” It includes factors such as dependability, predictability, and reputation. Affective trust, on the other hand, involves having mutual care and concern or emotional bonds. This has been described as “trusting from the heart.” Most trusting relationships have both cognitive and affective aspects that often reinforce one another.

2. Trust and trustworthiness are not the same

One way to understand trust is that it is a firm belief (cognitive and affective) in the goodness of something (we use the word “goodness” deliberately here, as dictionary definitions of trust tend to use descriptors of trustworthiness instead). We are often willing to trust people, companies, and institutions because we believe they are good, at least in the context in which we trust them.

Trustworthiness is a related, but different notion. Trustworthiness is defined as the perceived likelihood that a particular trustee will uphold one’s trust. (3) Like trust, it also has cognitive dimensions (such as competence, credibility, and reliability) and affective dimensions (such as ethics and positive intentions) that signal that the trustee “has what it takes” to meet the trustor’s needs and uphold their trust.

Imagine your interaction with your bank. Though you don’t necessarily need to trust the bank (i.e. believe in its “goodness”) as you would trust a spouse or a close friend, you must believe that the bank is trustworthy – i.e., it completes your transaction as intended, obeys laws, and follows a code of ethics. But you have to have trust in the overall monetary and financial system to even feel safe opening a bank account – something that was adversely affected after the financial crisis.

3. Trustworthiness and trust have a counter-intuitive relationship

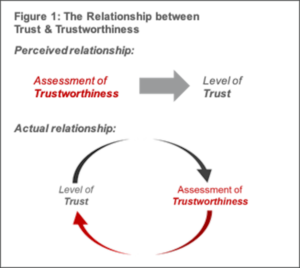
A rational point of view of the relationship between trustworthiness and trust would suggest that when you first encounter a system, you make an assessment of its trustworthiness (e.g., competence, predictability), and then you calibrate your level of trust accordingly.

But, alas, human beings are anything but rational. The evidence around human cognition and reasoning increasingly points to a counter-intuitive relationship: often, we enter into a new relationship (with a person or a system) with a level of trust that is influenced by the “bubbles” (i.e. communities and networks populated by like-minded folks) that we inhabit.

From there, we look for information to confirm our initial instincts (often referred to as “confirmation bias”). The type of information we look for or prioritize (e.g., cognitive vs. affective factors) varies by individual and by situation. This phenomenon help us understand, for instance, why individuals trust a news source that is perceived to be more aligned with their political views.

What this means

In the light of these dynamics, improving the trustworthiness of a system is often necessary and vital, but perhaps insufficient as a way to build public trust. Of course, we want to prevent a crisis of trustworthiness from eroding trust. For instance, public trust in Japan’s institutions suffered a severe blow as a result of the government’s bungled response to the Fukushima disaster in 2011. But, ensuring trustworthiness on its own may not be enough to overcome the contextual forces that undermine trust in the first place.

Furthermore, some efforts to improve trustworthiness, such as technical improvements to a system, are shown to decrease trust in the short-term, by introducing unpredictability as people have to navigate an unfamiliar tool or process. As we will discuss in the next part of this post, these complicated dynamics will have to be kept in mind as one tries to navigate the work of re-building trust in democratic institutions.

How We Are Strengthening Trust and Trustworthiness

For the Democracy Fund, and anyone else working on improving American democracy, it is hard to ignore the fact that trust in institutions is remarkably low by historical standards. This is especially true for Democracy Fund’s three main areas of focus – media and journalism, Congress, and elections. There are several factors that have led to this. For instance, our Congress and Public Trust systems map explores how the actions of members of Congress and their staff, the media, and the public interact to create the current state of Congress.

Previously, we talked a bit about why this decline in trust matters. The question now becomes, “can anything be done about it?” And in our efforts to do something about it, do we focus on trust, trustworthiness, or both?

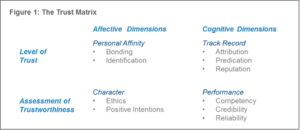
The “trust matrix”

As we discussed previously, level of trust and assessment of trustworthiness are related, but different notions, and each has cognitive and affective dimensions. These concepts are organized below into what we’ve come to call the trust matrix. The matrix also provides labels (e.g., “personal affinity”) to help readers easily navigate the differences among categories of concepts.

Implications for Democracy Fund

We recognize that in order to restore trust in democratic institutions, we need to work on multiple fronts. This by no means an easy task. Philanthropy, in general, tends to focus on solutions that address trustworthiness. For instance, an effort to improve education may focus primarily on educator competencies, or work to create a set of proficiency standards.

This may be because it can be a lot harder to affect people’s personal affinity for individuals or institutions, or public perceptions of individuals’ or institutions’ characters. While there may be few “tried and true” methods to address these factors, they are nonetheless important pieces in affecting individuals’ trust in systems and institutions. At the same time, it’s important to acknowledge that there are potential ethical implications with influencing people’s belief systems, and hence a responsible framework needs to be considered.

As we grapple with the myriad of intricacies here, we are beginning to come to terms with what types of approaches may fit under each quadrant of trust matrix. Below are some early hypotheses:

  1. Trustworthiness: We must increase the trustworthiness of institutions by equipping key stakeholders with better tools and practices (cognitive), and the promulgation and adoption of better standards and ethics (affective). For our elections work, this might mean identifying standards and promoting security in election systems, and providing election officials with the resources they need to maintain system integrity. Any failure within our election system could seriously undermine public trust. For our media and journalism work, this may mean re-thinking how we make the case for fundamental facts and combat misinformation, as well as working on practices around transparency and corrections.
  2. Level of Trust: We also need to tackle the trust deficit through strategies that speak directly to the public through engagement tools (cognitive) and the use of bonding and identification (affective). For our elections work, this may mean empowering the right messengers with tools and tactics to improve voter confidence. For our media and journalism work, this may mean having specific strategies that emphasize improving trust among historically marginalized communities, and other groups with special attention to increasing the diversity and inclusion of sources, stories and staffing.

At a time when our democratic norms are often undermined, we hope that our work to strengthen trust in trustworthy institutions will help build public confidence and participation in our democracy. As we continue to develop and hone our approach, we look forward to learning and sharing more with the field.

Thanks to Marcie Parkhurst, Nikhil Bumb, and Jaclyn Marcatili from FSG for supporting the research that informed this piece.


Works Cited:

1. Kelton, Kari. “Trust in Digital Information.” Journal of the American Society for Information Science and Technology (2008): 363-74.

2. McAllister, D. J. “Affect- And Cognition-Based Trust As Foundations For Interpersonal Cooperation In Organizations.” Academy of Management Journal 38.1 (1995): 24-59


3. Colquitt, Jason A. “Justice, Trust, and Trustworthiness: A Longitudinal Analysis Integrating Three Theoretical Perspectives.” The Academy of Management Journal, vol. 54, no. 6, 1 Dec. 2011, pp. 1183–1206. JSTOR.


Press Release

Voter Study Group Releases New Longitudinal Poll and Reports on the American Electorate

Democracy Fund
/
June 13, 2017

Groundbreaking Longitudinal Poll of the American Electorate Released by New Group of Conservative, Progressive, and Independent Scholars

New research and analysis by politically-diverse collaboration of public opinion experts will deliver insights on the evolving views of American voters

Washington, D.C. – June 13, 2017

The Democracy Fund Voter Study Group, a new research collaboration comprised of nearly two dozen analysts and scholars from across the political spectrum, today released its first trove of new data and analysis exploring voter perceptions before and after the 2016 election. During the intense political division of the 2016 presidential campaign, the Voter Study Group began collaborating across ideological lines to examine the underlying values and opinions that influence voter decision-making. The expert group commissioned the VOTER Survey (Views of the Electorate Research Survey) of 8,000 adults who had participated in similar surveys in mid-2016, 2011, and 2012. This unique longitudinal data set provides the basis for four new reports analyzing many of the most hotly-debated subjects of the presidential election, including economic stress, trade, race, immigration, and the evolution of the parties.

“Voters who experienced increased or continued economic stress were inclined to have become more negative about immigration and terrorism, demonstrating how economic pressures coincided with cultural concerns to produce an outcome that surprised most of us,” said Henry Olsen, senior fellow, Ethics and Public Policy Center and project director for the Voter Study Group. “However, not all Trump voters shared these sentiments, many of whom were simply partisan Republicans backing a candidate who echoed their longstanding concerns.”

“Our research follows the same set of voters from one election to the next, and looks at voters’ beliefs and affinities, to better understand what’s behind voter behavior and analyze what political polling typically misses,” said John Sides, associate professor at George Washington University and research director for Voter Study Group. “These data are helping us study what the rise of new movements and political figures mean for the future of our democracy.”

Key findings from the initial reports include:

  1. Most Voters Supported Their Traditional Party in 2016: Eighty-three percent of 2016 voters backed the candidate of the same party whose candidate they had supported in 2012.
  2. Views on Trade Not Highly Correlated with Party Switching: A voter’s views on free trade did not significantly impact their willingness to deviate from their prior partisan voting habits.
  3. Views on Immigration, Muslims, and Black People Were Key Drivers of White Voters’ Decision to Switch: Before the 2016 campaign, there was an increasing alignment between race and partisanship. Feelings toward immigration, black people, and Muslims became more strongly related to voter decision-making in 2016 compared to 2012. Those who opposed a path for citizenship for undocumented immigrants and believed that undocumented immigrants detract from American society were more likely to switch their support from President Obama to Trump.
  4. Long-term Economic Stress Also Contributed to Trump’s Rise: Voters who experienced negative attitudes about the economy in 2012 were more likely to express key negative cultural attitudes in 2016 even taking into account their earlier answers to the same questions.
  5. Trump General Election Voters Divided into Five Large Groups: The data shows that Trump voters generally share some common values but have different views on many key issues such as immigration, taxes, race, American identity, and size of the government. One analysis categorized Trump voters into five different groups: Staunch Conservatives (31 percent), Free Marketeers (25 percent), American Preservationists (20 percent), Anti-Elites (19 percent), and Disengaged (5 percent).
  6. Trump Voters Disagree Significantly on Economic Issues: Voters who switched from Obama to Trump are much more likely to hold liberal views regarding economic inequality and government intervention than Trump voters who supported Mitt Romney in 2012. Donald Trump’s strongest supporters also tended to express more support for Social Security and Medicare than did any other cohort of Republican voters.
  7. Democratic Partisans Agree on Most Issues: Nearly 45 percent of all voters could be classified as holding traditional liberal views on economics, social issues, and issues respecting national identity. Clinton received 83 percent of these votes, and nearly 78 percent of her total support came from these voters.

The four initial reports, along with an executive summary, provide in-depth analysis of key data from the VOTER Survey and are available are available online. (Author affiliations are listed for identification purposes only.)

“The unprecedented tenor and direction of the 2016 election and the ensuing political debate are not the result of one campaign or even one candidate, but instead of deeper trends in how American voters view their democracy and their political system,” said Joe Goldman, Democracy Fund president. “The wide-range of political perspectives represented in the Voter Study Group reflects an urgent need—one that goes beyond party—to better listen and respond to the needs of Americans across the country.”

The VOTER Survey and reports were made possible by a grant from Democracy Fund to the Ethics and Public Policy Center to conduct new research about the changing trends among the American electorate.

“The unprecedented tenor and direction of the 2016 election and the ensuing political debate are not the result of one campaign or even one candidate, but instead of deeper trends in how American voters view their democracy and their political system,” said Joe Goldman, Democracy Fund president. “The wide-range of political perspectives represented in the Voter Study Group reflects an urgent need—one that goes beyond party—to better listen and respond to the needs of Americans across the country.”

Toplines and crosstabs from the VOTER Survey can be accessed online. Throughout this year, the Voter Study Group will release the full data set as well as additional reports on this and future surveys online.

_________________________________________________

VOTER Survey Methodology Summary

In partnership with the survey firm YouGov, the VOTER Survey interviewed 8,000 Americans in December 2016 who had been previously interviewed both in 2011-2012 and in July 2016. A complete survey methodology is available online.

About the Ethics and Public Policy Center (EPPC)

Founded in 1976 by Dr. Ernest W. Lefever, the Ethics and Public Policy Center is Washington, D.C.’s premier institute dedicated to applying the Judeo-Christian moral tradition to critical issues of public policy. From the Cold War to the war on terrorism, from disputes over the role of religion in public life to battles over the nature of the family, EPPC and its scholars have consistently sought to defend and promote our nation’s founding principles—respect for the inherent dignity of the human person, individual freedom and responsibility, justice, the rule of law, and limited government.

About the Democracy Fund

The Democracy Fund is a bipartisan foundation established by eBay founder and philanthropist Pierre Omidyar to help ensure that our political system can withstand new challenges and deliver on its promise to the American people. Since 2011, Democracy Fund has invested more than $60 million in support of modern elections, effective governance, and a vibrant public square.
_________________________________________________

Contact

Lauren Strayer
media@voterstudygroup.org
(202) 420-7928

Harold Reid
media@voterstudygroup.org
(404) 995-4500

Press Release

Public Opinion Reinforces the Exemplary Work of Local Election Officials on November 8

Democracy Fund
/
November 21, 2016

WASHINGTON D.C. – November 21, 2016 – According to a new national survey conducted by the Democracy Fund in the days following the election, 85 percent of voters say they had a pleasant experience on November 8th, including overwhelming majorities of voters who supported either President-elect Donald Trump or Secretary Hillary Clinton.

“Despite rhetoric about potential widespread election rigging or hacking, local election officials successfully ensured that ballots were securely cast and accurately counted. Their efforts are clearly reflected in a positive voter experience and the fact that no significant improprieties have yet come to light in canvasses or audits,” said Adam Ambrogi, Elections Program Director, Democracy Fund. “Even if your candidate did not win, Americans can take pride in our decentralized, transparent, and secure election system.”

The voter experience is critical because it fosters trust in electoral outcomes. The Presidential Commission on Election Administration (PCEA) put forward its recommendations in large part because inefficient or poor administration decreases trust in the outcome, and bad voting experiences might cause the public to disengage in future elections.

Data shows that large swaths of Democrats and Republicans express nervousness about key safeguards within the system, including the idea that fraud, rigging, or hacking may actually have impacted the outcome of the 2016 presidential election. In fact, there is even substantial concern among voters who believe that the 2016 election outcome was “very fairly” determined – meaning that even the voters who are most trustful of the system after the election still have considerable concerns about specific threats to the process.

“The Democracy Fund is committed to working with local election officials to help educate voters about the transparent and decentralized safeguards in place so that they can be confident in the outcome and trust the results,” said Natalie Adona, Elections Research Associate, Democracy Fund. The newly released survey also points to a need for continual efforts to guarantee that all Americans feel safe when they cast their ballots. Twenty-three percent of African American voters, and 18 percent of Hispanic voters, say they felt fearful, intimidated, or had problems voting, compared to 12 percent of white voters.

“In a heated election, passions and rhetoric can sometimes rise, but it is imperative for our democracy that all voters feel equally comfortable going to the polls,” Ambrogi said. “Some of these disparities in the voter experience are troubling, and should cause all of us to examine this issue before the next election.”

This online survey of 1,500 U.S. adults was conducted November 9–11 via VeraQuest, Inc. Panelists are required to double opt-in to ensure voluntary participation in the surveys they are invited to complete. Adult respondents were randomly selected to be generally proportional of the age, sex, region, race/ethnicity, income, and education strata of the U.S., based on Census proportions, and quotas were established for demographics to confirm sufficient diversity of the sample in proportions so that they would resemble that of the United States.

###

About the Democracy Fund

The Democracy Fund is a bipartisan foundation established by eBay founder and philanthropist Pierre Omidyar to help ensure that the American people come first in our democracy. Today, modern challenges—such as hyper partisanship, money in politics, and struggling media—threaten the health of American Democracy.

Read our report on the progress made towards more secure and smooth elections since the Presidential Commission on Election Administration’s recommendations were released in 2014: http://bit.ly/PCEAProgress.

Contacts:

Lauren Strayer, Director of Communications
Democracy Fund
(202) 420-7928
media@democracyfund.org

Jennifer Krug
Porter Novelli
(212) 601-8264
Jennifer.krug@porternovelli.com

Blog

New Research Reveals Stark Local News Gaps in New Jersey

/
August 6, 2015

At the Democracy Fund, we seek to foster a more informed and active electorate by providing voters with the information, opportunities for engagement, and skills they need to make informed choices. A particular focus of this work has been to build up journalism at the local and state house level, and we have supported the Institute for Nonprofit News nationally and more recently the News Voices Project in New Jersey with an objective strengthening news provision at the local level. The latter with the specific objective of collaborations between newsrooms and communities.

We also realize we don’t yet have a full picture of the state of journalism at the city level and that motivated us to support the new research published today by Rutgers University regarding the level of news provision in three New Jersey Communities. From the release:

In “Assessing the Health of Local Journalism Ecosystems: A Comparative Analysis of Three New Jersey Communities,” researchers examined the journalistic infrastructure, output, and performance in the New Jersey communities of Newark, New Brunswick, and Morristown.

The research, supported by the Democracy Fund, the Geraldine R. Dodge Foundation, and Knight Foundation, indicates substantial differences in the volume and quality of reporting. Low income communities saw less coverage than higher income neighboring cities.

In Newark, with a population of 277,000 and a per capita income of $13,009, there are only 0.55 sources of news for every 10,000 people. Whereas, in New Brunswick, with a population of 55,000 and a per capita income of $16,395, there are 2.18 news sources for every 10,000 people. But the differences are most stark in comparison to Morristown, which has a population of 18,000 and a per capita income of $37,573 but 6.11 news sources for every 10,000 people.

These pronounced differences in the availability of sources of journalism were then reflected in how much journalism was produced within these three communities:

  • Morristown residents received 23 times more news stories and 20 times more social media posts from their local journalism sources per 10,000 capita than Newark residents, and 2.5 times more news stories and 3.4 times more social media posts per 10,000 capita than New Brunswick residents.
  • New Brunswick residents received 9.3 times more news stories and six times more social media posts per 10,000 capita than Newark residents.

Similar differences across the three communities often persisted when the researchers focused on aspects of the quality of local journalism, such as the extent to which the stories were original (rather than repostings or links to other sources); the extent to which the stories were about the local community; and the extent to which the stories addressed critical information needs, such as education, health, and civic and political life.

Professor Phillip Napoli, the lead author, said, “If journalism and access to information are pillars of self government then these findings suggest those tools of democracy are not being distributed evenly, and that should be cause for concern.”

A study of three communities is not conclusive, and over time we hope that this report will be supplemented by an analysis of a larger number of communities and complemented by others that use complementary research methodologies. That said, we believe the results published today will aid us as we consider how we approach our work and help inform the work of others. As we think further about this we welcome comments below from journalists and others who are at the coalface at this transitional moment.

Blog

Guest Post: New API Research shows Growth of Fact Checking and Partisan Challenges

Jane Elizabeth
/
April 22, 2015

This is cross-posted from the American Press Institute. View a full version with charts here and read more about the Democracy Fund’s support of fact checking here.

The amount of fact-checking journalism produced in the United States is increasing dramatically, and while there are limits to its persuasiveness, it is a measurably effective tool for correcting political misinformation among voters, according to new scholarly research conducted for the American Press Institute and released today.

The number of fact-check stories in the U.S. news media increased by more than 300 percent from 2008 to 2012, one of the studies found. That accelerates the growth in fact-checking journalism found in the prior national election cycle.

Fact-checking journalism also succeeds in increasing voter knowledge, according to controlled experiments with audiences.

“Fact-checking journalism is growing rapidly but is still relatively rare and heavily concentrated among outlets with dedicated fact checkers,” said the University of Exeter’s Jason Reifler, one of the scholars engaged in the research.

The three studies released today, conducted by scholars at six universities, build on existing research and constitute the most comprehensive effort to date examining the work of journalists to police political rhetoric.

Among some of the other findings:

  • More than eight in 10 Americans have a favorable view of political fact-checking.
  • Fact-checking is equally persuasive whether or not it uses a “rating scale” to summarize its findings.
  • Fact-checks of inaccurate statements are more persuasive when the consumer and the politician belong to the same political party.
  • Democrats, in general, have a more favorable view of and are somewhat more persuaded by fact-checking journalism than Republicans.

The results released today are part of a series commissioned through API’s Fact-Checking Project, an initiative to examine and improve fact-checking in journalism. The program is funded by the Democracy Fund, the William and Flora Hewlett Foundation and the Rita Allen Foundation.

The Growth of Fact-Checking

By several measures fact-checking is growing. In the study of the frequency of fact-checking — either original fact-checks or stories about such work — the number of fact-checking stories increased by more than 50 percent from 2004 to 2008 and by more than 300 percent from 2008 to 2012. The growth occurred mostly at 11 newspapers that partnered with PolitiFact, one of the country’s most prominent fact-checking organizations, but the number of such stories also more than doubled between 2008 and 2012 at media outlets unaffiliated with PolitiFact.

The findings on the growth in fact-checking are reinforced by the Reporters’ Lab at Duke University, which found that the number of fully active fact-checking organizations in North America increased from 15 in April 2014 to 22 in January 2015.

The API study, authored by Lucas Graves at the University of Wisconsin, Brendan Nyhan at Dartmouth College and Reifler, also explored what conditions encourage more fact-checking journalism to occur. The researchers found that reporters who are reminded of fact-checking’s journalistic value produce significantly more fact-checking stories than those who are not reminded. Yet, the study found, reminding reporters that readers like fact-checking did not have a statistically significant effect.

Fact-checking and consumer knowledge

A second study, also by Nyhan and Reifler, found that more than eight in 10 Americans have a favorable view of political fact-checking journalism.

But there are some partisan differences in public perceptions of the practice: Republicans don’t view fact-checking journalism as favorably as Democrats do, especially among people with high levels of political knowledge.

Americans also appear to learn from fact-checks written by journalists, the study found. Knowledge of relevant facts increased by 11 percentage points among people who were randomly exposed to a series of fact-checks during the 2014 election, compared to a control group. In general, the study found, fact-checks are more effective among people who already have higher levels of political knowledge.

The study is the first randomized controlled trial estimating the effects of exposure to fact checking over time.

‘Pants on Fire’ Optional

Another of the studies examined the effectiveness of “rating scales” in fact-checking journalism. This research, conducted by Michelle A. Amazeen of Rider University, with Graves, Emily Thorson of George Washington University, and Ashley Muddiman of the University of Wyoming, found that a fact check is an effective tool for correcting political misinformation, whether or not it employs a “rating scale.” When given a choice, however, readers selected a fact check with a rating scale.

Such ratings are used by fact-checking organizations such the Washington Post’s Fact Checker, which uses a Pinocchio scale, and PolitiFact, whose Truth-O-Meter includes the well-known “Pants on Fire” rating.

Fact-checks of inaccurate statements are less persuasive when the reader and politician belongs to opposite political parties, the researchers found. These readers tend to think the opposing party politician’s statement was false, even before they read the correction. For this reason, political fact-checking may be of particular benefit during primary contests, according to the authors, although fact-checking currently is more likely to occur during general election cycles than in primaries.

The study also found that a non-political correction — in this case, regarding a statement made by a breakfast cereal company official — was more effective when a rating scale was added to the text.

The Future of Fact-Checking

Overall the studies suggest that fact-checking is achieving its core aim: countering the spread of political misinformation. And the public largely appreciates this work.

“The results suggest that corrections of misinformation do help people to more accurately understand the world around them,” Amazeen said.

Reifler added, “In short, people like fact-checking and it appears to help them become better informed.”

Read the full studies here:

The Growth of Fact Checking

Estimating Fact-Checking’s Effects

The Effectiveness of Rating Scales

In the coming weeks, API will publish more findings from its fact-checking research, including the prevalence of misinformation on Twitter and a report by journalist Mark Stencel examining the impact of fact-checking on the behavior of those in the political arena.

Democracy Fund
1200 17th Street NW Suite 300,
Washington, DC 20036