Blog
/
November 2, 2022

In a nation of over 258.3 million eligible voters, election officials’ myriad duties differ from jurisdiction to jurisdiction—small to large, rural to urban—and from voter to voter. Despite these many differences, there are common themes and predictable challenges faced by every official. And of course, every official has experienced unforeseen events and unexpected circumstances that force them to assess, reform, and adapt. As any official will tell you, there is always another election on the horizon. 

The Democracy Fund/Reed College Survey of Local Election Officials provides a window into the attitudes, actions, and needs of the public servants who manage US elections. Surveys during the last three election cycles have illustrated the stable features of the system and the way that the challenges of the moment impact the people administering the democratic process.  

Local Election Officials

More than half of election officials are elected – 57 percent overall, but in small jurisdictions with fewer than 5,000 registered voters that increases to 67 percent – while 27 percent are appointed, and 15 percent are hired to fill a position. Just over half of these races are partisan and the other half are non-partisan, and the vast majority of elected officials (81 percent) ran uncontested in the general election. The need to attract candidates and talent will only continue to grow as veteran officials leave the field in growing numbers. 

In the 2018 survey, officials’ recent experiences with foreign interference in election cybersecurity impacted the complexity of their work. In 2020, the pandemic and extraordinary polarization of the candidates and the electorate created stress and rapid change in methods of voting that election officials had to manage. The 2022 survey illustrates more emergent challenges as election officials report coping with the combinations of mis- and disinformation about elections, violence against election officials, and extreme partisan disparities in the public’s confidence in election results. 

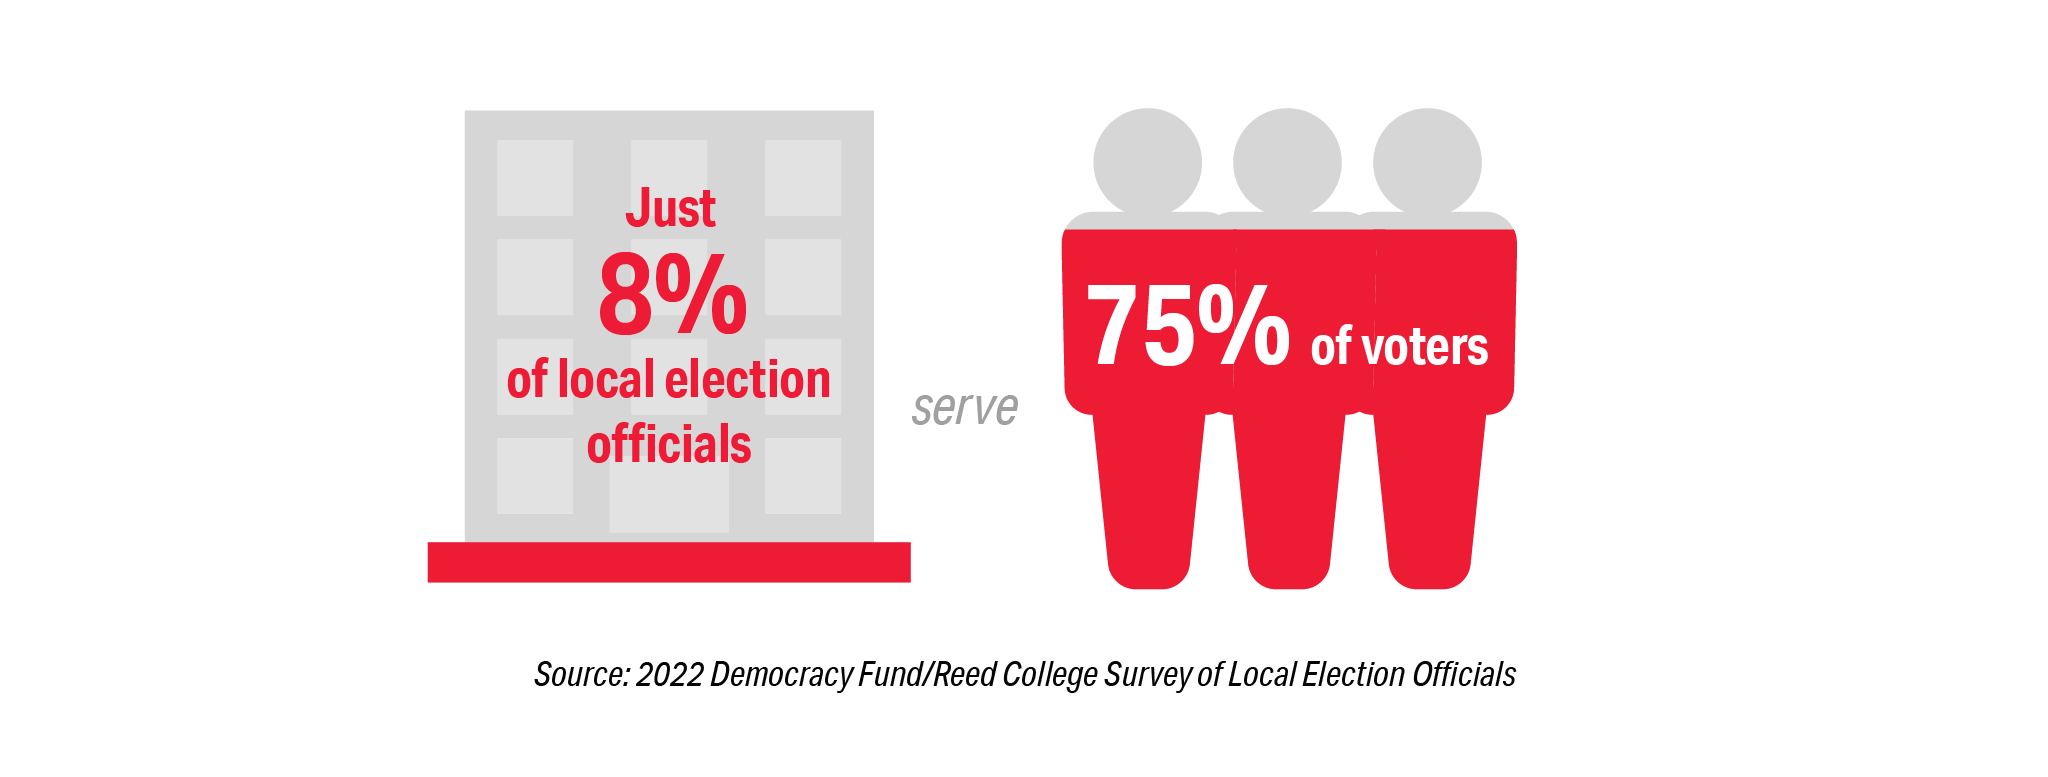
All of this is happening in an environment where the biggest disparity in the election system continues to be geographic. Elections are managed by local jurisdictions and there are tremendous differences between election offices that serve the largest and smallest populations. Seventy-five percent of all offices serve only 8 percent of voters, and 8 percent of our election offices serve 75 percent of voters. This disparity is driven by the fact that the largest 2 percent of offices serve half of the nation’s voters.  
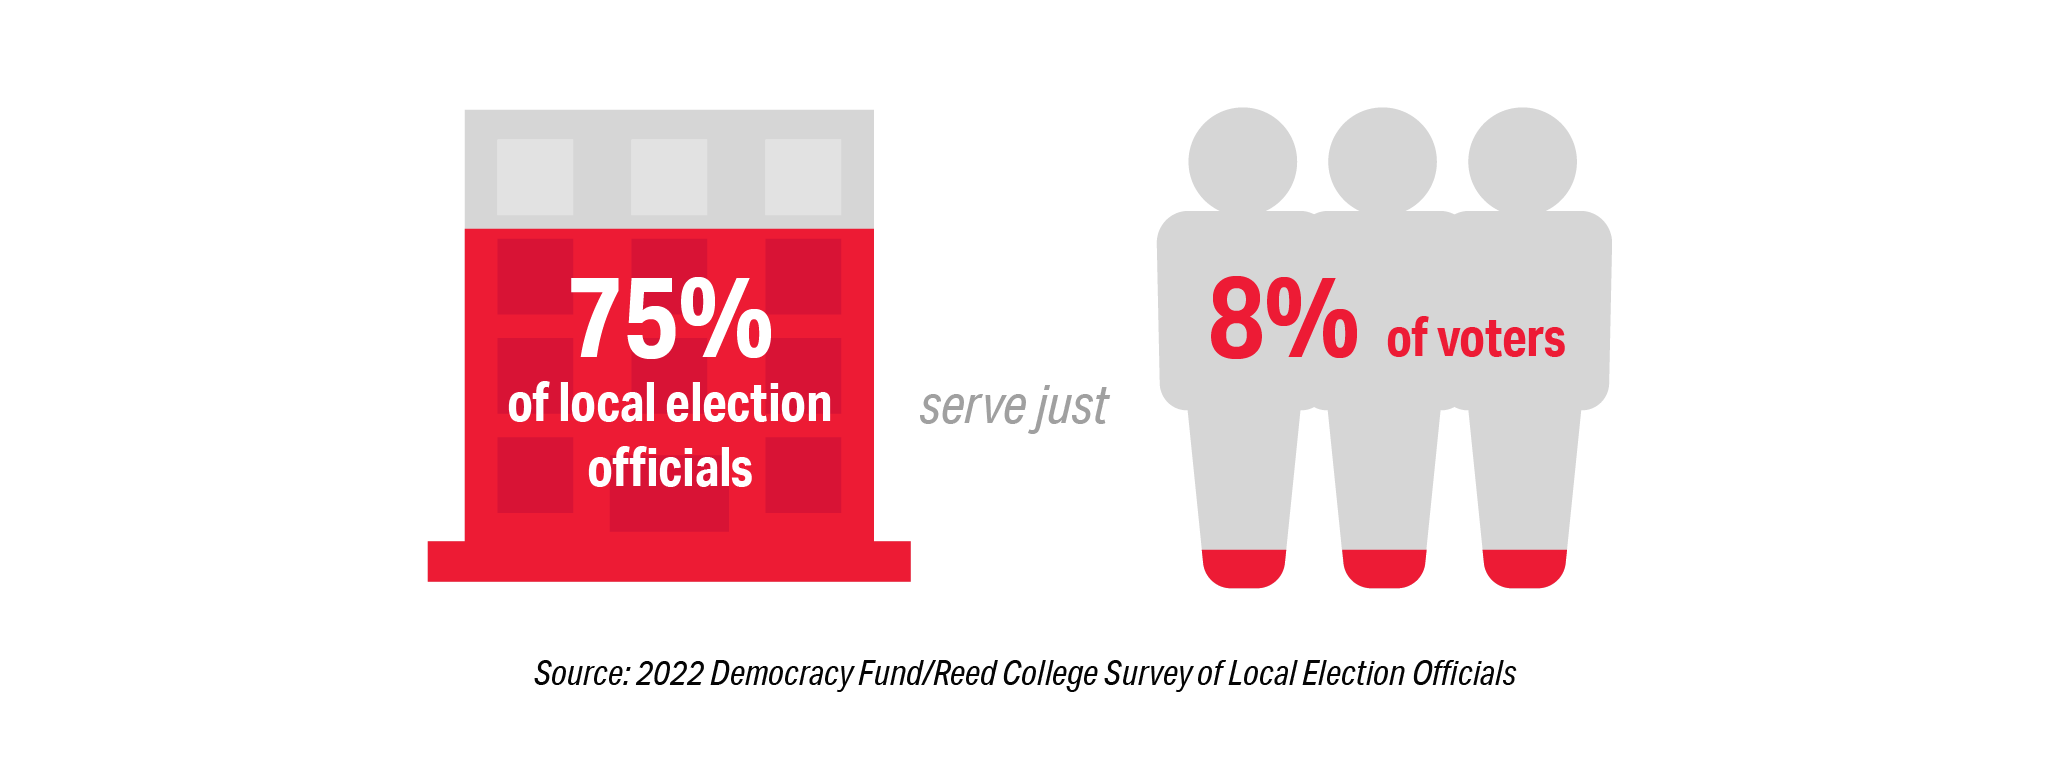
Graphic of building and people stating that 75% of local election officials serve 8% of voters

Graphic of building and people stating that 8% of local election officals serve 75% of voters


The impact of an increased election-related workload is disproportionally higher on smaller jurisdictions than their counterparts in medium and large jurisdictions. This should not be surprising since one third of all election offices do not have even one full-time employee. In small jurisdictions that serve less than 5,000 voters that number increases to 53 percent. The increased workload for many may have been the result of concerted campaigns to flood election offices with Freedom of Information Act requests around the 2020 election based on conspiracy and conjecture. 
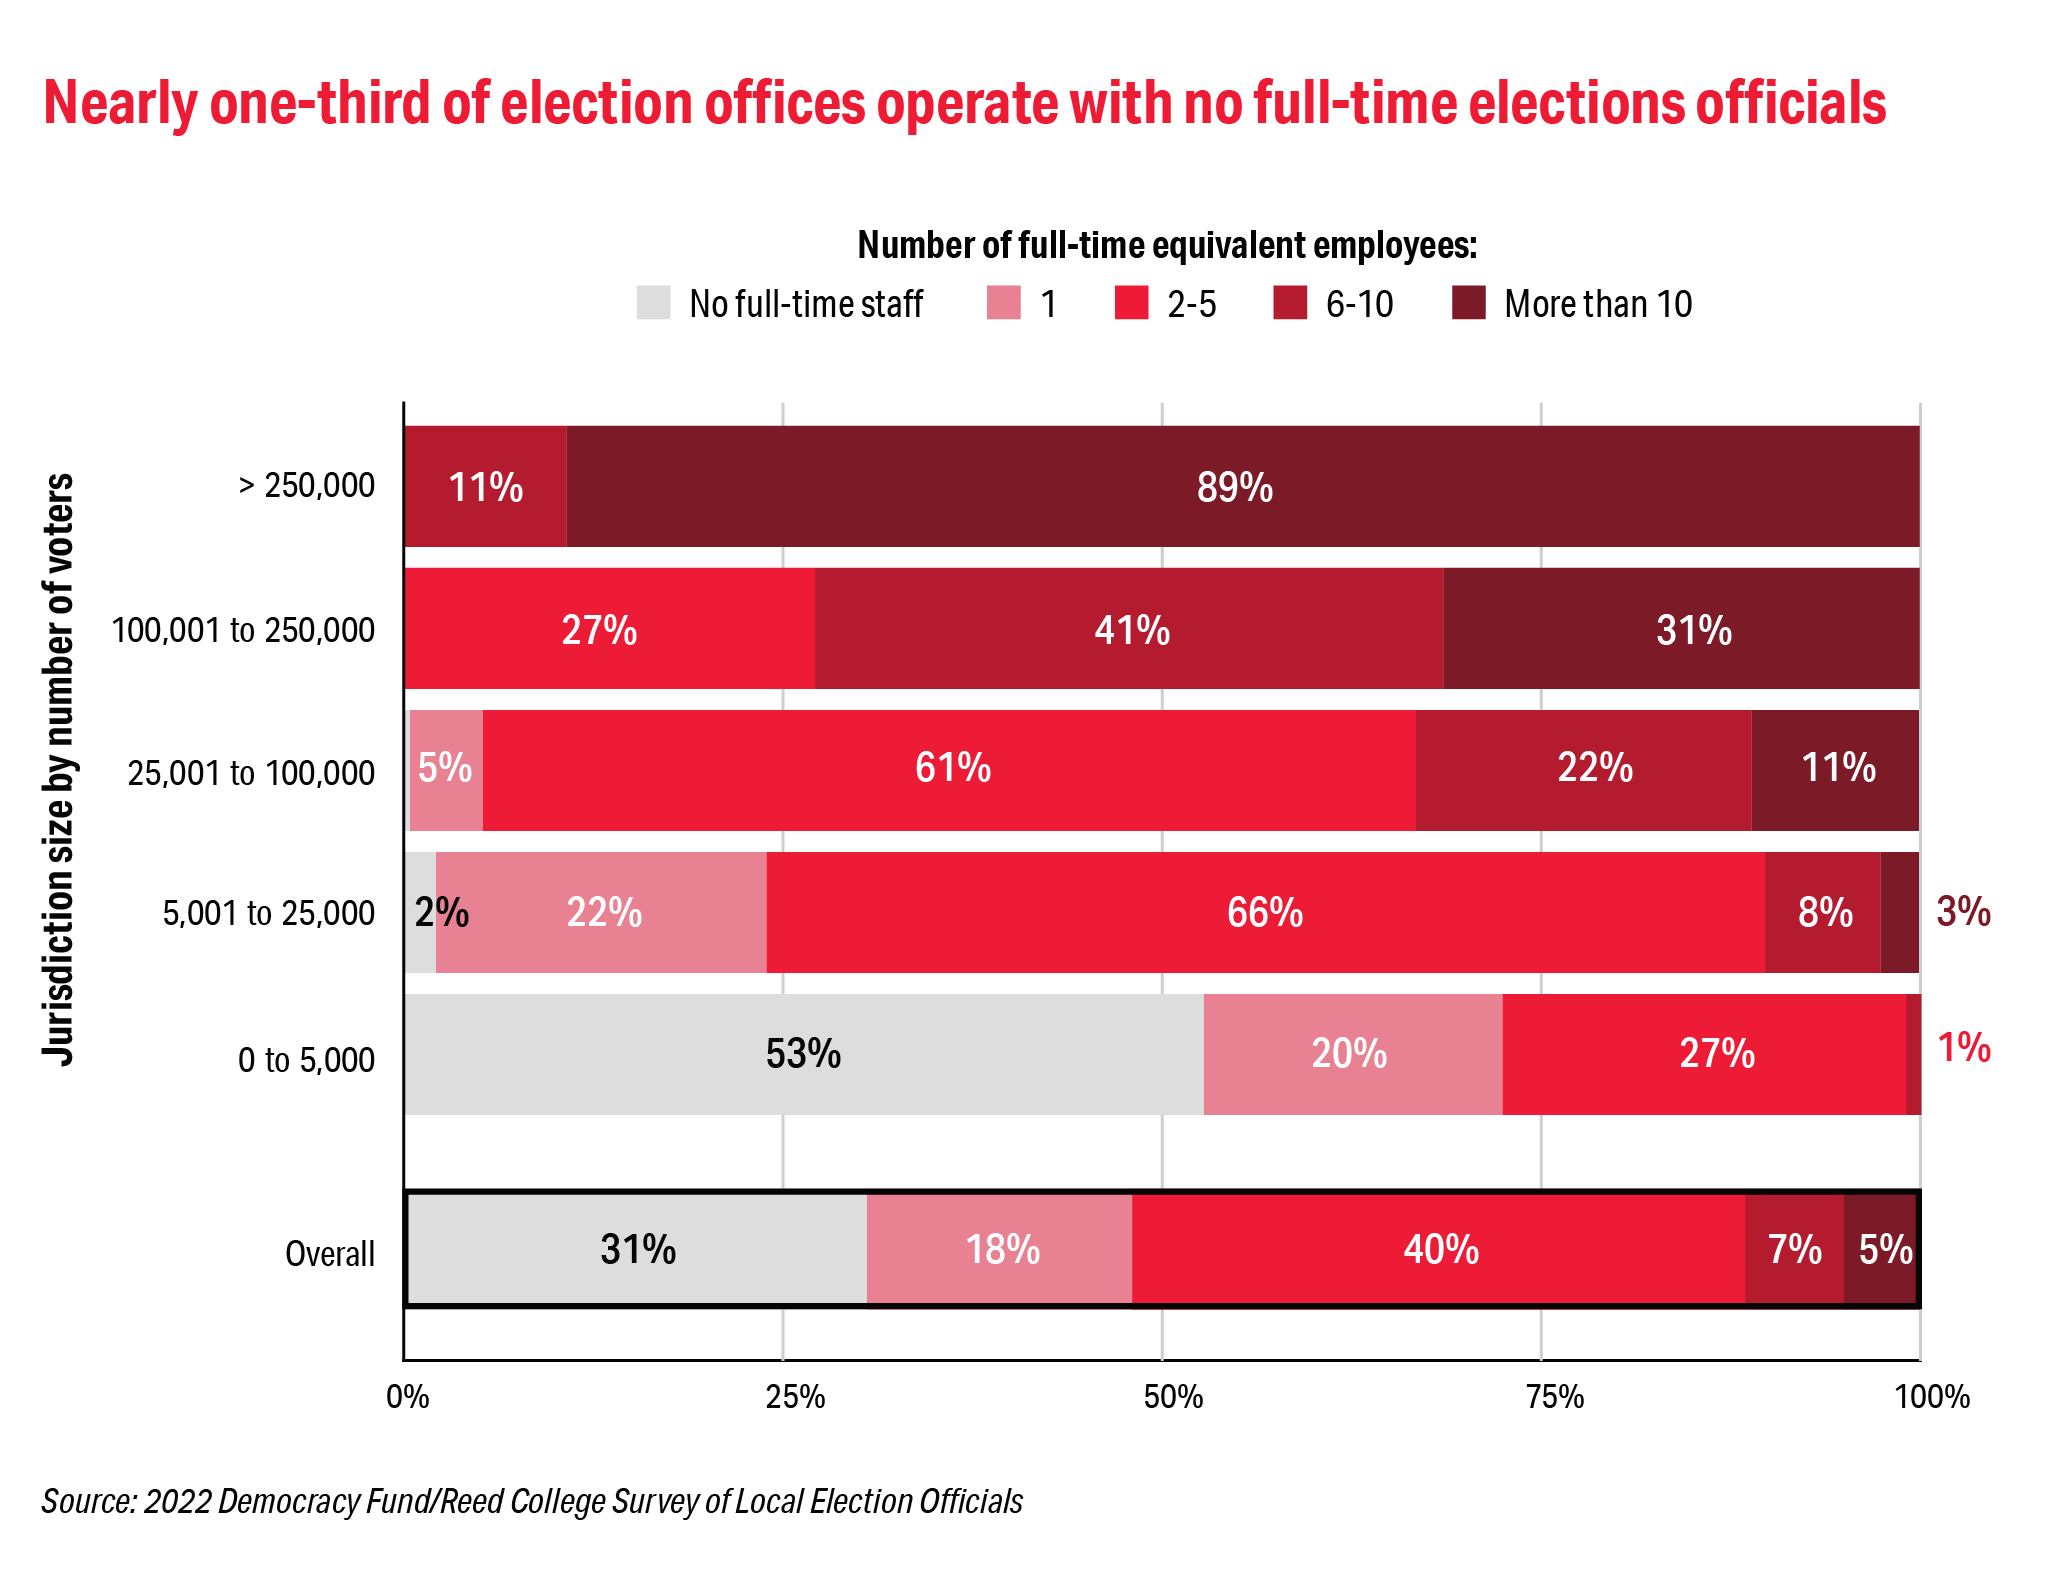
Graph of different jurisdiction sizes by number of voters showing that nearly one-third of election offices have no full-time elections officials.

Each election cycle, the Democracy Fund/Reed College Local Election Official (LEO) Survey has asked local officials about key aspects of their work including preparedness for the upcoming election, job satisfaction, and training needs for the election officials and members of their staffs. 

LEOs retain a commitment to meeting the demands of their jobs and the challenges of finding adequate polling locations and poll workers – especially sufficient bilingual workers and accessible facilities – persist with varying degrees across jurisdiction sizes.  

Overall job satisfaction among LEOs remains high, but there are cracks in the veneer. The percentage of LEOs who do not think they can maintain a work/life balance has increased and the percentage who say their workload is reasonable has dropped since 2018. 
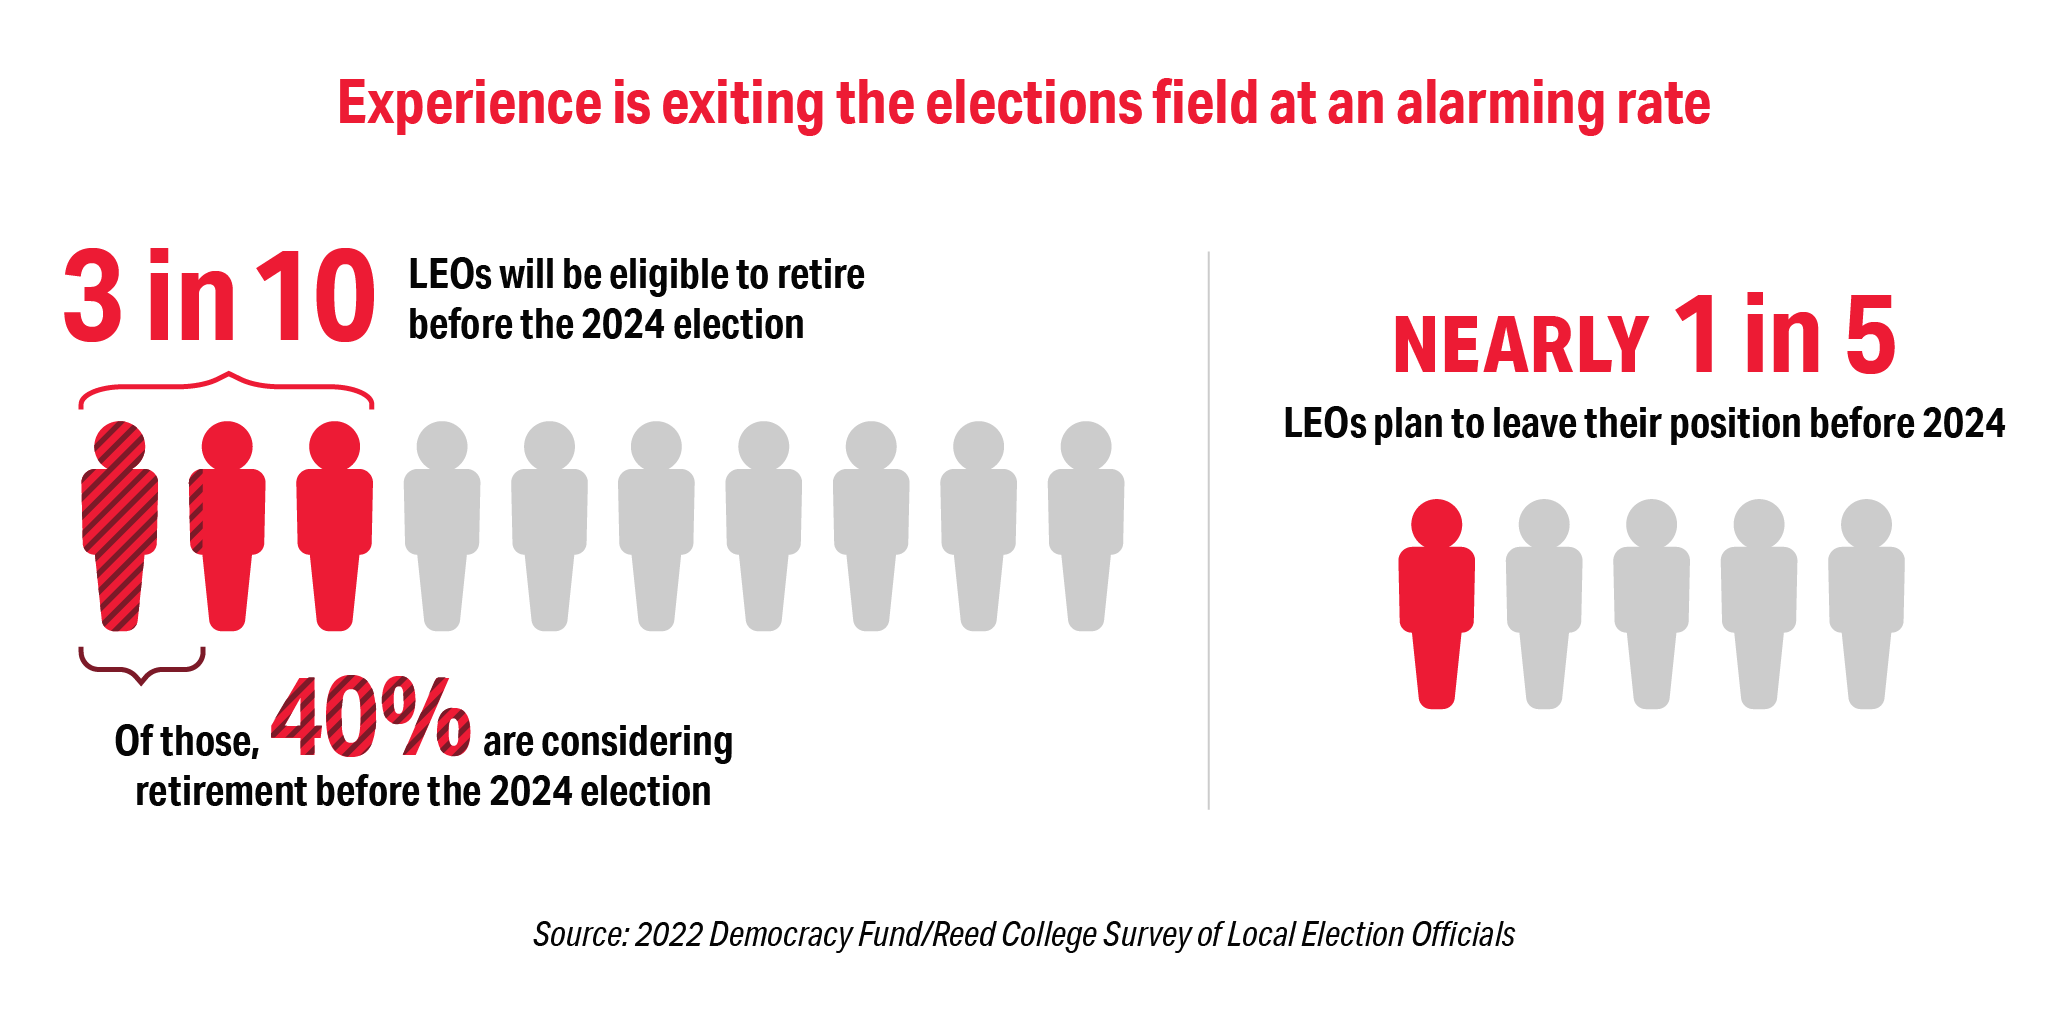
Graphic showing 3 in 10 local election officials will be eligible to retire before the 2024 election and that nearly 1 in 5 plan to leave before 2024.

Among the 2022 survey participants, close to one third of the election officials are eligible to retire before the 2024 election—and 39 percent of those eligible plan to do so. Of these respondents, retirement eligibility is the highest reason for leaving the field (51 percent) but “I do not like the changes in my work environment that occurred during and after the November 2020 election” (42 percent) and “I do not enjoy the political environment” (37 percent) followed close behind. For those who are not near retirement age their number one reason for leaving the field was cited as “changes in how elections are administered make the work unsatisfying” (48 percent) and an alarming 28 percent citing that they plan to leave the field based on “concerns about my health or personal safety, aside from COVID concerns.” 

Disruption in the Field

One in four respondents have experienced threats of violence. Officials across all jurisdiction sizes and political affiliations experienced these threats, but the threat environment is much more severe in larger jurisdictions compared to smaller jurisdictions. For example, while 14 percent of LEOs serving jurisdictions with less than 5,000 registered voters told us that they had experienced abuse, harassment, or threats, the percentage increases to two-thirds of LEOs serving in the largest jurisdictions. Similarly, 20 percent of LEOs who told us they were Republicans said they experienced threats, compared to 30 percent of Independents and 34 percent of Democrats. These differences should not disguise the overall result: threats against LEOs are far too real, far too regular, and far too common.
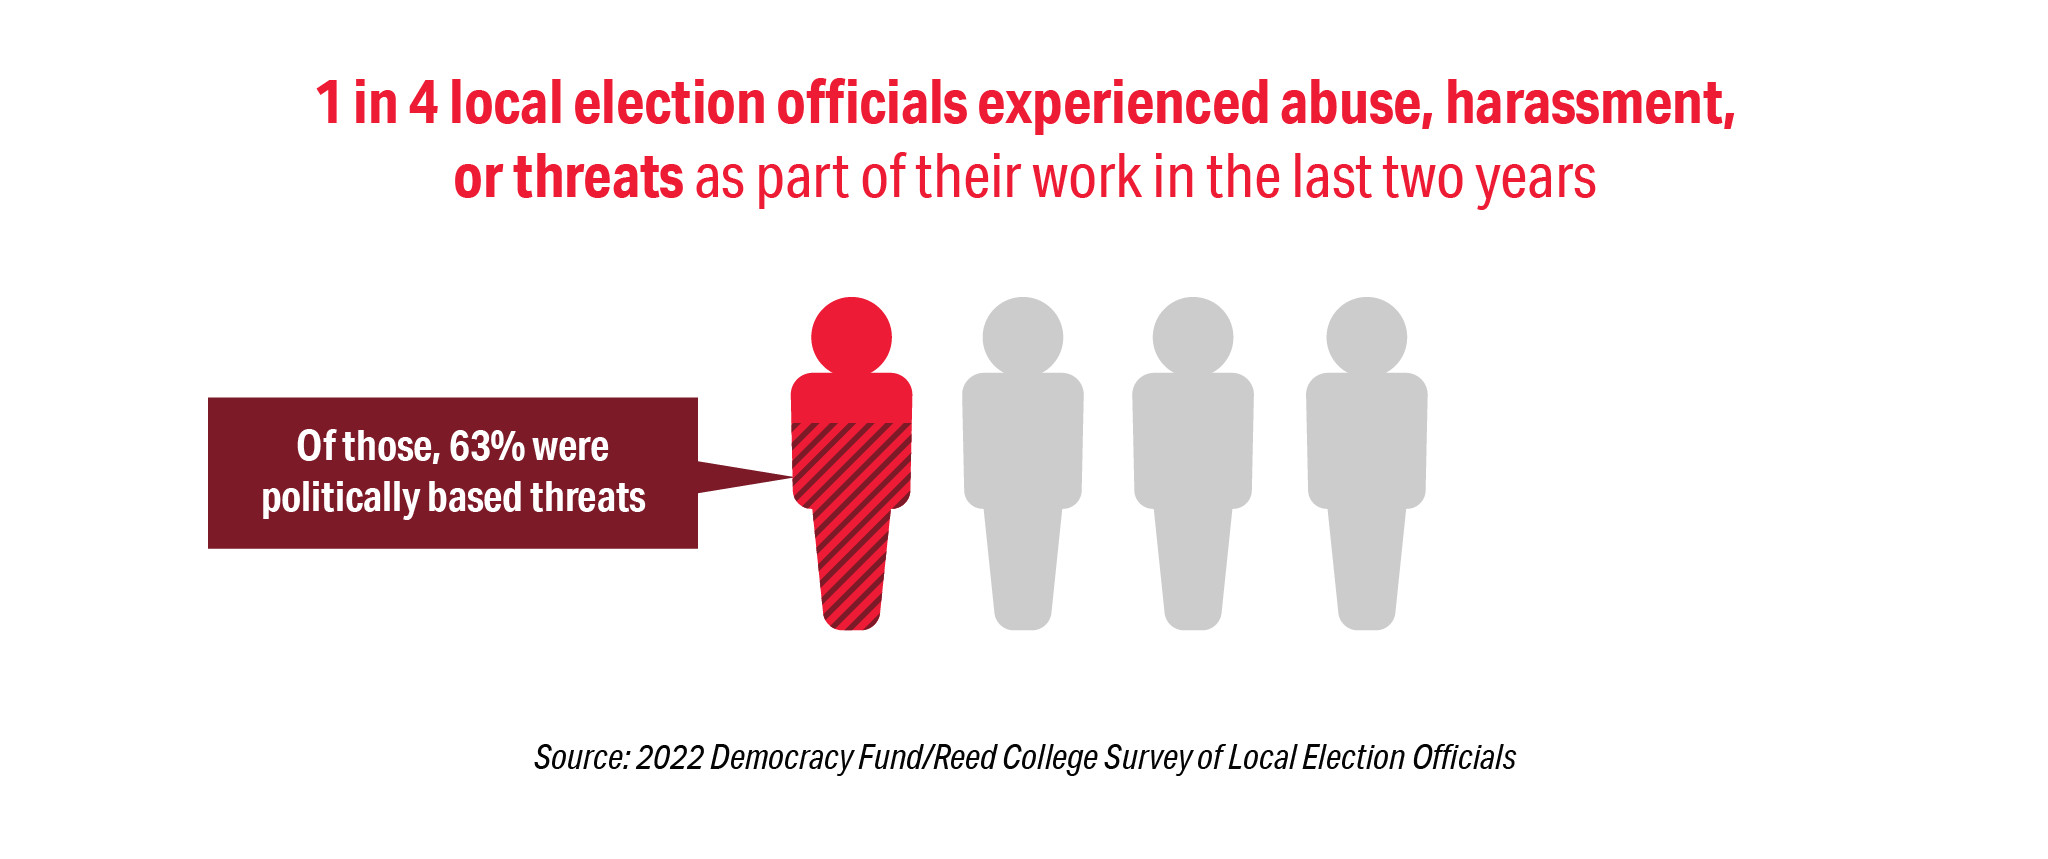
Graph stating that 1 in 4 local election officials experienced abuse or threats as part of their work in the last 2 years. 63% were politically-based.

The preponderance of threats targeting election officials are politically based threats. Our 2022 survey showed that 63 percent of threats received were politically motivated. The narrative driving these threats—that the 2020 election was illegitimate and that LEOs were complicit in allowing the election to be stolen–-has manifested in threats to election professionals and their families, and changes to state election laws. More than half (55 percent) of the survey respondents said that they have had legislation passed that impacts how they conduct the election—with 35 percent saying those changes improved election administration and 46 percent saying the new laws did not improve election administration.  
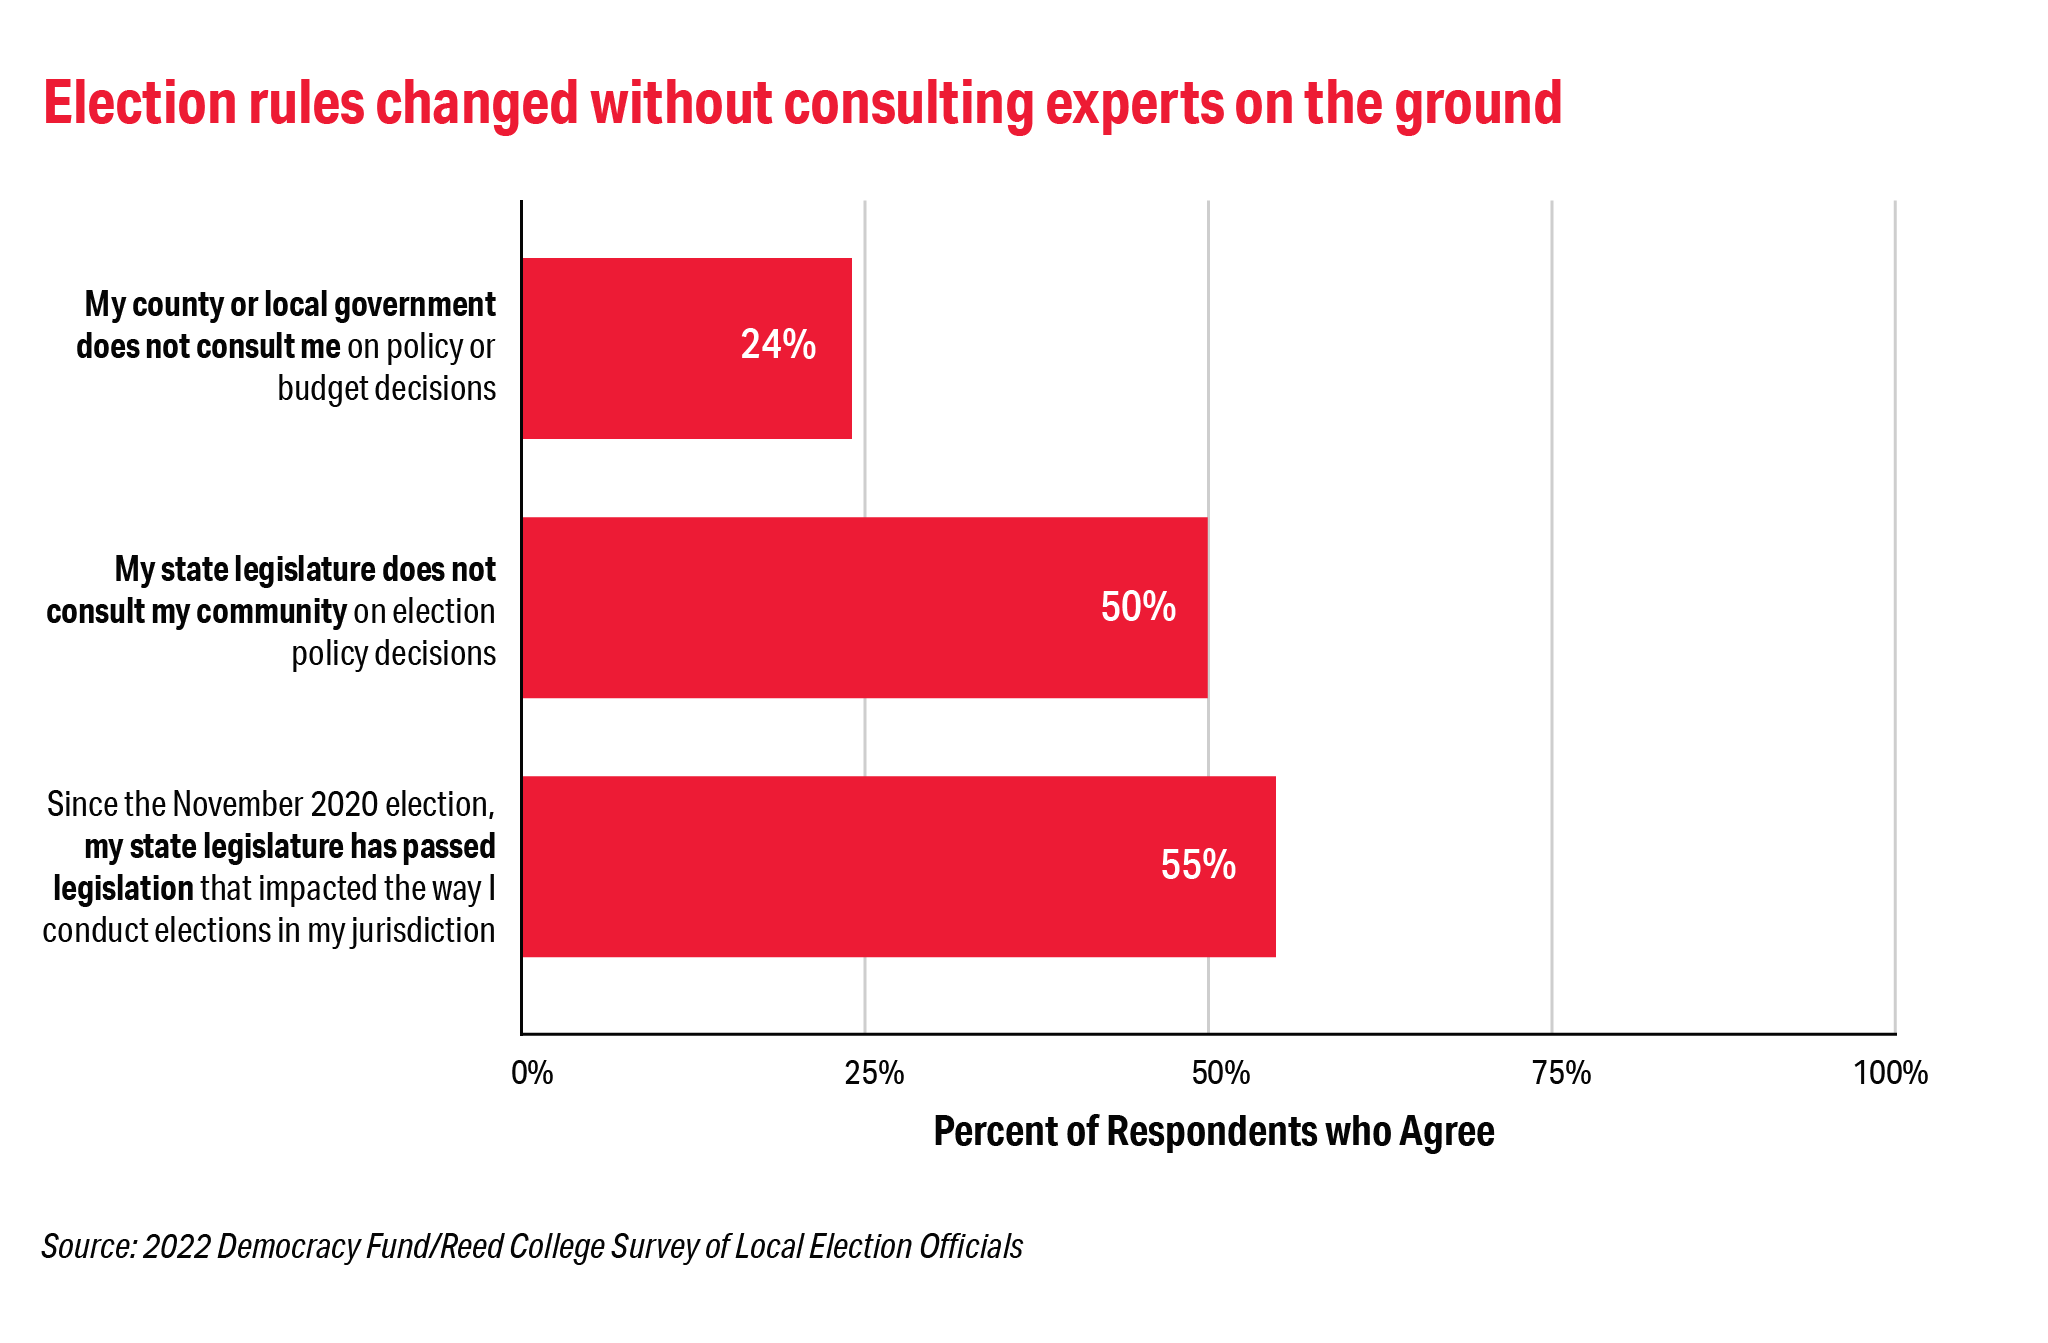
Graph stating: 24% of LEOs said they were not consulted on policy decisions. 50% said their community was not consulted, 55% said policies were passed that impact election administration.

The majority – 66 percent – of election officials surveyed this year expressed concern about threats and harassment. When asked how seriously various organizations take the threats to election officials, 43 percent said that their state’s chief election official (in most states, the secretary of state) takes the threats “very seriously.” However, LEOs felt that others took the threats far less seriously: only 27 percent for local law enforcement, 25 percent for federal law enforcement, 17 percent for the state legislature and for the national media, 14 percent for the local media, and 12 percent for the U.S. Congress.            

About the Survey and Interviews

The 2022 survey of local election officials was a self-administered web and hardcopy survey conducted from June 21 to September 22, 2022. This study used a LEO sample collected by the team, with a sampling frame based in part on national lists of local election officials and the sizes of their jurisdictions. From this frame, the team drew a sample of 3,118 LEOs, sampling jurisdictions in proportion to the number of registered voters they serve and targeting the chief election official in each jurisdiction to complete the survey. A total of 912 LEOs completed the survey, including 652 surveys completed via web (71 percent) and 260 (29 percent) completed via hardcopy with an overall response rate of 30 percent.   

Survey findings are often presented by jurisdiction size to understand differences in experiences. 

  • Fifty-seven percent of local election officials serve in jurisdictions of 5,000 or fewer voters. 
  • Twenty-seven percent serve in jurisdictions of 5,001 to 25,000 voters. 
  • Ten percent serve in jurisdictions of 25,001 to 75,000 voters. 
  • Six percent serve in jurisdictions of more than 75,000 voters. 

While most officials serve in small jurisdictions, the vast majority of voters live in large jurisdictions — over 70 percent of voters live in jurisdictions with more than 75,000 voters and are served by only 500 officials. It’s important to consider the possible differences in scale, responsibility, and resources between different jurisdiction sizes when interpreting results from any survey of this population. Where overall results are presented, they are weighted to ensure that means can be generalized to local election officials nationwide. Further information about the sampling and weighting process is available at the Reed College Elections & Voting Information Center’s project website.  

Explore additional 2022 content and learn more about the Democracy Fund/Reed College Survey of Local Election Officials through Reed College’s Elections & Voting Information Center. Prior publications from the survey series are also available below.  
Report
/
July 28, 2022

From its inception, Democracy Fund has invested in organizations supporting election administration. We believe that well-functioning election operations are a core component of a healthy election system. At the end of 2021, we commissioned an independent evaluation of the Elections & Voting Program’s Voter Centric Election Administration portfolio to review how our theory of change was executed and how the election system has shifted. Here, we reflect on the findings from that evaluation and invite you to read the full report 

Voter Centric Election Administration Portfolio History

The landscape of election administration in 2014 is a far cry from what we experience today. At that time, the findings of the Bipartisan Presidential Commission on Election Administration were widely praised and pointed the way toward evidence-based solutions to election challenges – such as long lines at the polls and errors on voter lists – that made use of developments in technology. Election administration has always been complicated, especially in the highly-decentralized U.S. system. However from 2014-2016, the field experienced clarity of purpose and a relatively-uncontentious bipartisan consensus on best practices to move the field forward. 

In this context, Democracy Fund developed a theory of change that focused on two needs of the field:

  1. Strong networks of election administrators for knowledge-sharing across and within states
  2. Innovative practices and technology designed for election administrators to use. 

To meet the first need, we identified the leaders of state election administrator associations and hosted convenings with them twice a year in a “train the trainer” model, whereby they would learn best-in-class practices to take back to their state associations of election officials. For the second need, we invested in a wide range of civic technology tools, research, and guides developed by civil society organizations that could be used by administrators to better serve voters. Our goal was to scale and spread practices that would improve the voting experience nationwide.  

Evaluation of the Portfolio’s Impact

An evaluation of the portfolio’s impact, conducted by Fernandez Advisors, focused on the ways that election officials at the state and local level have engaged in Democracy Fund’s network convenings and used tools, training, and resources in which we have invested. The report found that investing in tools and resources for election administrators helped the field adapt to shifts in voter expectations for online services and new voting methods. Our grantees’ programs helped to improve the design of election websites and ballots, helped administrators adapt to early voting and mail voting policies, and helped voters learn where to find a polling place or ballot drop box easily and accurately. These are just a few examples of the ways our grantees supported administrators’ efforts to serve voters.  

This portfolio was especially well-timed to meet the unusual needs of the 2020 election when many states rapidly adjusted their voting policies and practices to respond to the COVID-19 pandemic. Many states offered voters more flexibility to vote early at home or at voter centers in order to avoid crowds at Election Day polling places. These states could not have rapidly adopted new voting methods without following the examples of states that had spent years innovating and experimenting with flexible voting practices. Democracy Fund grantees were instrumental in helping states learn quickly from these examples because they had documented implementation processes and offered technical assistance. 

While network-building, tools, and research have been instrumental in improving election administration, the failure of local and state governments to adequately resource election offices remains a significant problem. Significant and ongoing technology changes (such as online voter registration and ballot tracking) present adoption challenges for many election administrators and their staff due to both the lack of funding for technology investments and maintenance and the difficulty covering the range of expertise needed with the very small staffs that manage elections in all but the largest jurisdictions. For example, election officials interviewed for the evaluation report that they do not have the capacity to counter growing mis- and disinformation targeted toward voters. 

The job of managing elections has grown increasing complex as the field faces new challenges. Local election officials must be experts in many areas: human resources, information technology, direct mail processing, public relations, cybersecurity, and more. Most election officials are managing this load with little staff capacity. In the 2020 Democracy Fund/Reed College Survey of Local Election Officials, over half of respondents said they work in an office with just one or two staff members who may not even be full-time. Participants in Democracy Fund’s state association convenings praised the information and opportunity to share knowledge and resources with peers from other states and bring ideas back to their colleagues. However, limited staff capacity and urgent demands makes it difficult for many officials to spend time adopting new practices.  

Summary of Findings & Key Takeaways

When Democracy Fund began investing in civil society organizations focused on election administration, it was still a young field, with limited philanthropic investments supporting the work. We used a systems and complexity approach to analyze the needs of the field and identify the gaps and leverage points that could improve the health of election administration. We played a role in catalyzing new nonprofit organizations that support election officials and in funding emerging election sciences research. The COVID-19 pandemic upended the 2020 primary elections and made evident the importance of well-resourced and well-functioning election administration. In response, the field of organizations supporting election administration scaled up as more donors began funding this work. Even as the context shifts over time and the field adapts, strong election administration is essential to the health of a just and equitable election system.  


Resource
February 17, 2022

Removing Language Barriers from the Voting Process

Democracy Fund’s Language Access for Voters Summit is an annual event that aims to remove language barriers from the voting process. The 2021 convening was held Dec. 13-14, 2021, following the Dec. 8th release of the Census Bureau’s new Section 203 language determinations under the Voting Rights Act—which provide language assistance in U.S. elections.

To help election officials navigate and implement the necessary changes, the agenda included discussions with local, state and federal election officials, voting rights advocates, and translation experts. Participants shared pragmatic ideas, tools, and best practices for providing language assistance—focusing officials’ immediate needs in the lead-up to the 2022 midterm elections.

Celebrating the Diversity of Languages in the United States

The two-day event featured a collection of speaker-submitted videos in Armenian, Bengali, Dine’ (Navajo), English, Korean, Mandarin, Spanish, and Yup’ik. These represent a small sample of the languages election officials provide voter assistance for across the United States.

Speakers read the 2020 Presidential Election ballot in various languages from their jurisdictions, highlighted the critical value of language and culture integration in formal settings like polling places, and shared personal stories of how language access has played a role in their own life or someone they love.

The topics, presentations, materials and resources for each day of the Dec. 2021 summit can be viewed and downloaded below.
Toolkit
Tammy Patrick
/
May 22, 2020

Every election we ask ourselves, what motivates voters to participate? Could it be the love of a charismatic candidate? The dislike of a less-than-desirable one? Passion for a specific ballot initiative? Do voters show up to the polls out of habit? The answer is as varied as the voting population, as is the reason voters do not participate.

Research shows that while voters’ confidence in their own vote being counted accurately remains relatively constant, their belief that results at the national level are correct is in decline. As we work through reestablishing trust in our elections following Special Counsel Robert Mueller’s 22-month long investigation, the threat of interference in our elections by another nation-state remains.

The American public wants to believe that when they vote it means something—we are teaching elections officials about a new way to audit our elections and check for the accuracy every voter deserves. As with most election administration processes, implementation success lies in preparation—and Risk Limiting Audits (RLAs), which some proponents often refer to as the “cheap and easy” method to check the accuracy of the results, are no exception.

Democracy Fund recently launched the Election Validation Project to increase trust in elections through rigorous audits, standards, and testing. Part of this project is the release of Knowing it’s Right—the first Risk-Limiting Audit report which serves as a summary to capture where we currently stand on risk-limiting audits; an overview of what policymakers need to know; and as a guide or workbook on how practitioners can prepare to implement. The materials demonstrate the rigor that a jurisdiction needs to go through in order to conduct a meaningful audit, the decisions that need to be made along the way, and what to contemplate as this relatively young procedure continues to evolve.

The what and the how of an RLA are not well understood by many, which is why we created guidance for elections administrators to save time, money and ensure that the correct candidate won.

The idea is simple, although not many people have heard of a risk-limiting audit. Risk-limiting audit is a post-election audit that takes a random sample of voted ballots and manually examines those ballots for evidence the originally reported outcome is correct. An RLA limits the risk of certifying a contest with the wrong winner.

We are proud to support Jennifer Morrell, a nationally recognized election official with over eight years of experience managing local elections, to lead the Election Validation Project and spearhead the outreach on this guidance. Morrell’s work in Colorado was instrumental in the successful implementation of the first statewide risk-limiting audit and she has since spent time traveling across the country working on post-election audits. This report is the cumulative documentation of her effort.

We believe sound election administration policy and its practical application can ensure the American electorate is well served and that our democracy is strong. We are dedicated to that work and appreciate all who strive for that ideal along with us.

Lisa Danetz
/
January 9, 2020

Over the past few years, I’ve traveled across the United States working to understand and improve state motor voter registration services, as yet another step towards ensuring all eligible individuals have the opportunity to register to vote in the United States. My goal has been to learn from each state’s experience, share its findings with others, and encourage strong connections between the Department of Motor Vehicles (DMV) officials – who, through the motor voter process, are now the source of 45% of the nation’s voter registration activity – and the election officials who administer the elections.

Colorado, in particular, has stood out as a state that has implemented one of the more modern, collaborative, and user-friendly motor voter registration systems in the country.

In five years, Colorado implemented motor voter registration upgrades including updated policies and technology, and successfully transformed an inefficient multi-step paper-based system into a modern streamlined electronic automatic voter registration system that complies with the National Voter Registration Act (NVRA). These changes led to a decrease in DMV transaction time by 20 to 30 seconds, contributed (along with a larger DMV IT system modernization) to a four-minute reduction in the DMV’s initial wait time, and increased access and usage of motor voter registration opportunities.

HOW COLORADO MADE THIS HAPPEN

While each state has its own set of obstacles to navigate – like differing agency priorities, resource shortages, bureaucratic resistance, and technology challenges – Colorado’s story of success can serve as a guide to overcoming these obstacles to serve a state’s citizens and ultimately improve the strength of our democracy. Most notably:

1. Relationship Development

In Colorado, relationship development was key. Both Elections Director Judd Choate and DMV Senior Director Mike Dixon recognized and prioritized relationship-building and communication between their offices to address and upgrade the state’s motor voter registration processes. Over several years, the development of a strong and trusted relationship between their teams allowed process upgrades to come to fruition. The initiation of the state’s NVRA Working Group was especially significant, bringing all stakeholders together to provide input and buy-in, and to recognize the potential of the DMV IT system modernization project.

2. Internal Advocacy

Differing missions and priorities between agencies do not need to be a roadblock. In particular, while voter registration is one of the core concerns of elections agencies like the Colorado Department of State (CDOS), it is simply one of many responsibilities handled by the DMV—and one for which they often do not receive direct funding. That can make it difficult for an entity like a DMV to prioritize process changes when what’s in place seems to work. The legal memos and explanatory presentations that CDOS prepared for CDOR helped move along the understanding of the need to make process fixes—and the resulting benefits.

3. Investment of Resources

More frequently than not, process changes involve the investment of significant resources – both time and money – and these process changes were no different. Fortunately, the Colorado DMV was already planning an IT modernization of its driver’s license system. Including motor-voter registration modifications was a cost-effective method to improve that system as well. The costs for the motor voter changes were easily absorbed into the project. In addition, for those upgrades that were not part of the original DMV system modernization, CDOS paid for the DMV motor voter registration technology upgrades and worked with the Colorado Department of Revenue (which houses the DMV) to write the requirements.

LOOKING AHEAD TO 2020

Perhaps the most important lesson to be learned from Colorado’s experience is that our systems must constantly adapt and evolve to fit the changing needs of our citizens and voters. In fact, the Colorado legislature recently passed a bill in May 2019 that requires the state to adopt and implement “Oregon style” automatic voter registration by July 2020. As the state prepares to implement this latest set of changes, it is the perfect time to examine the breadth of the already-implemented process upgrades and the robust data available about their impacts to date. While what works for one state is not a guarantee that it will work in another, Colorado’s efforts provide important lessons for policymakers to consider in devising their own motor voter registration upgrade plans.

To receive a copy of the Colorado case study, and to learn more about Democracy Fund’s work on motor voter registration and NVRA compliance, please contact elections@democracyfund.org.

Lisa Danetz conducts this work on behalf of Democracy Fund, and has worked in the voting rights, money in politics, and democracy field as a policy expert, advocate, and lawyer for 20 years. She has developed a particular expertise on voter registration through government agencies and, most recently, has been doing work within the AAMVA (DMV) community to provide information and support related to their voter registration and election responsibilities. In addition to her work with Democracy Fund, she has worked with Demos and the National Voting Rights Institute, among others. She received her B.S. from Yale University and her J.D. cum laude from New York University School of Law.

Report
Natalie Adona, Paul Gronke, Paul Manson, and Sarah Cole
/
June 26, 2019

Local elections officials (LEOs) are the stewards of our democracy, but oftentimes they are left out of important conversations about the future of our elections nationwide. The LEOs from our survey are the chief elections officers in their local jurisdictions. Not to be confused with poll workers, the LEOs surveyed in our new report oversee local election processes and are responsible for ensuring the voting process is fair, free, and secure. Among their many responsibilities, LEOs execute the election laws in their state, make decisions that define the voter experience, and train the permanent and temporary employees that interact with the electorate.

It might be hard to imagine but (depending on how you count) between 7,000-10,000 local election officials manage the front line of elections in the United States. Despite their recognition as the people who run elections, LEOs are often left out of national conversations about reform and may not have a seat at the table when important policy decisions are made at the local, state, or federal levels—decisions that they alone will ultimately implement.

Stewards of Democracy: The Views of American Local Election Officials details the findings of the Democracy Fund-Reed College 2018 Survey of Local Election Officials (2018 LEO Survey), and is part of our effort to create a space for these stewards of democracy to be heard. The survey is designed to capture the collective experience of officials across the country, and to help us learn more about their perspectives on election administration, access, integrity, and reform. The results should be interpreted as a snapshot of opinion taken in the midst of a competitive midterm election.

More than 1,000 LEOs from across the country responded to our survey. Our survey respondents serve over 81 million registered voters. They manage offices with staffs of one or two in the smallest jurisdictions to over 1,000 employees in the largest (not including poll workers). Our hope is that this report will be the start of an ongoing attempt to elevate LEO’s voices in efforts to modernize and secure American elections.

The report breaks down the findings of the survey into four sections:

  • Meet Your Local Election Official – This section provides data on the professional and demographic profile of the typical LEO including LEO workload, years in service, pay, professional training and other demographic information.
  • Running the 2018 Election – This section covers findings on 2018 election preparedness including information on resources, staff, meeting the challenges of cybersecurity, and confidence in voter registration list security.
  • Voter-Centric Elections: Education and Outreach – This section discusses LEO attitudes regarding accessibility, including voter education and outreach.
  • Improving Elections Using New and Old Tools – This section focuses on the adoption of modernization and of technology, such as online voter registration and automatic voter registration systems to improve elections. It also covers our analysis of LEO opinions, in their own words, on how they think elections can be improved, including legislative and policy changes involving voting.

The bottom line is that all the LEOs we surveyed care deeply about their ability to administer elections in an accessible, efficient, and secure fashion. We were particularly moved by how our survey demonstrated LEOs’ dedication to a positive voter experience and to nonpartisan election administration. Respondents in our survey made it clear that they have and will continue to be good stewards of democracy—but resources, staffing, and coordination between state and local officials are areas of concern.

We plan to solicit LEO opinions again, at different times, using different lenses. We hope that our efforts encourage conversations and collaboration with LEOs and lead to reforms that best serve the American electorate—providing policymakers with invaluable insight into the makeup of the election administration field and its evolving needs as it hopefully becomes more diverse in the coming years.

Democracy Fund’s Elections Program supports, among other things, nonprofit organizations that improve elections processes and provide assistance to election officials themselves. As we work with grantees and partners, we are reminded time and again of the important role of the LEOs ensuring that our voices are heard.

/
October 18, 2018

Democracy Fund’s healthy democracy framework identifies voting as the cornerstone of our democracy. The elections process ought to be free, fair, accessible and secure; give voters the information that they need to make informed choices; and must “provide voters with confidence in the integrity of election outcomes and assurance that they have a voice in our democracy.”

We know that the public’s trust and confidence in elections provides the basis for a healthy election system and a healthy democracy. However, prior to heightened concerns around elections cybersecurity, we were surprised to find that there are not many people studying this dimension of public opinion. In the spirit of learning and dialogue, we decided to examine data collected from 2008-2016 via the Cooperative Congressional Election Study to better understand the public’s views on our elections process.

In collaboration with Paul Gronke of Reed College, I am excited to share our findings in a new Democracy Fund report, “Understanding the Voter Experience: The Public’s View of Election Administration and Reform.” This report offers insight into the individual-level decision to vote or not, the public’s’ knowledge and application of voter registration requirements, the over all voter experience, and the public’s trust and confidence in U.S. elections.

The Good News

In Understanding the Voter Experience, we find that the public generally perceives that elections are run with integrity, understands most of what is required of them in order to vote, and have a good experience when voting. When compared to other institutions of in trust, election administration ranks well.

Other encouraging findings include that many people realize that they are responsible for registering and updating their registration; most respondents provide good or excellent job performance ratings for their poll workers and their state and local election officials; and majorities of the folks we surveyed are confident that their own votes and votes across the country are counted as intended.

Areas for Improvement

Our report also shows that the public can benefit from ongoing educational efforts—especially in states that have recently implemented modernization reforms or that have recently changed identification requirements. Significant numbers of our respondents were confused or unfamiliar with their state voter identification requirements pre-election, and our data indicate that they learn about these requirements post-election.

We also found a significant number of people did not know whether online voter registration is available in their state. In fact, nearly 50 percent of the respondents did not know whether their respective states offered online voter registration, and over 17 percent answered incorrectly as to whether their state offered it.

Our report also examines the public’s heavily reliance on the internet for basic election information, which is important because we find that a lack of information may keep people from voting, especially down-ballot races. The data shows that approximately 30-40 percent of respondents consistently felt they did not have enough information to vote on key races like state attorney general, secretary of state, and state senator races.

We hope that “Understanding the Voter Experience” will help election officials, lawmakers, advocates, and others better understand attitudes of the American people toward one of their most-cherished rights, and will encourage more probing of public attitudes about our election system. As you read the report, we welcome your questions and feedback. Please do not hesitate to email me at nadona@democracyfund.org.

Stacey Scholl
/
October 18, 2018

Today we are pleased to unveil a new and improved electionline — America’s only politics-free source for election administration news and information.

In January 2018, we announced that electionline had become a project of Democracy Fund’s Elections program. We felt then, as we do now, that it is a vital platform for finding trusted news and information about the people and processes that guide our nation’s elections, and for sharing tools, best practices, and innovative ideas for improving the voting experience. Our simple goals for redeveloping the site were to enhance its capabilities and expand content — but our long-term plans are to create a place where readers are exposed to new ideas, opportunities for continuing education, and relationship building.

To do this, we started by thinking long and hard about the site’s current audience and their needs. Starting today, election administrators, academics, voting advocates and other regular readers of electionline will find new items of interest on the site, including:

  • A calendar of national, state and other field-relevant events;
  • A directory of organizations and their areas of expertise;
  • Reports, trainings, tools, guides, and other materials;
  • A marketplace featuring job openings in the elections field and information on used election equipment for sale; and
  • Better search functionality throughout

Electionline remains the only place on the internet to find state-by-state curation of daily election administration news. In addition to publishing the classic electionline Weekly newsletter, we will also begin sharing original reports and exclusive content from leaders and experts in the field — making the site a must-read for local election officials, civic organizations, and journalists who cover elections.

While redeveloping the site, we learned two really insightful lessons that might be helpful for others who are developing virtual spaces for information sharing and engagement.

First, collaborate with your audiences and include some “outsider” perspective. As our team weighed important decisions about the look and feel of the website, we were grateful to receive insight and direction from many readers who already trust and rely on electionline.

Second, reflect your values. Redeveloping or creating a new platform is an opportunity to reinforce essential characteristics that inform readers who your organization is, and what they care about. For us it meant focusing on authenticity (even if it means publishing unflattering stories about ourselves or our partners); transparency about who we support with resources in the field; and cultivating greater interest for under-covered areas of importance like voting trends for overlooked communities.

Through this process, we hope we were able to successfully incorporate the feedback we heard from current readers. We also hope that the new electionline website more deeply resonates with all those who are interested in elections in America. We’re excited to hear your thoughts and reactions as you explore the new website. Please visit www.electionline.org and let us know what you think!

Report
Natalie Adona and Paul Gronke
/
October 16, 2018

This report provides insights into the state of public opinion about election administration and reform. The findings are primarily drawn from the 2008–2016 Cooperative Congressional Election Study (CCES), a survey conducted each federal election year since 2006. i We hope that the findings contained in this report, and suggestions for future research, will help election officials, lawmakers, advocates, and others understand attitudes of the American people toward one of their most-cherished rights.

The takeaways in this report include:

Deciding to Vote

  • A significant number of nonvoters choose not to participate because they do not like the candidates, and some may be generally unenthusiastic about participating.
  • Lack of information may keep people from voting in certain contests, especially down-ballot races.

Navigating Voter Registration

  • Many people know that they are responsible for registering and updating registration. Most know where to register and that a move requires them to update their information. Most people are likely to rely on internet searches for registration information.
  • Many people could benefit from ongoing education about how the voter registration process works in their states, especially states that have recently implemented modernization reforms.
  • The majority of people support online voter registration but might not know whether it is available in their state. Some continue to prefer to use the paper registration form. The public does not currently express strong support or opposition to automatic voter registration.

The Voter Experience

  • There is not one most-preferred method of voting. Many like the convenience of early in-person and absentee or vote-by-mail voting. Absentee or vote-by-mail voters are more likely than early in-person voters to say that they distrust certain aspects of the voting process. Not surprisingly, voters provide compelling reasons to continue to vote in the way they have done before.
  • People express a higher tolerance for waiting in line when they are told that the wait is 15 minutes. Tolerance decreases as the anticipated wait time increases. i More about the CCES is offered in the Survey Methodology section of this report and on the project’s website at: https://cces.gov.harvard.edu.
  • Significant numbers of people are confused or unfamiliar with their state voter identification requirements. Many appear to learn about these requirements during election cycles, suggesting the need for ongoing education.
  • Overwhelming majorities of people provide good or excellent job performance ratings for their poll workers. Most people like that poll workers are polite and knowledgeable and demonstrate other signs of excellent customer service.

Trust and Confidence Measures

  • Election administrators enjoy higher levels of public trust when compared to officials in other public institutions. State and local election officials should continue to enjoy high public approval if they are viewed as nonpartisan experts.
  • Levels of voter confidence are influenced by the voter’s polling place experience, partisanship, and support for the winner (sometimes referred to as the “winner’s effect”). Most are confident that their own votes and votes across the country are counted as intended, though there is a noticeable gap between individual and national level confidence. There was a dramatic up-tick in voter confidence levels among Republicans and Trump supporters in 2016.
  • Perceptions of voter fraud, electoral integrity, and electoral fairness are deeply intertwined and powerful indicators of a healthy democracy. Most people believe that our elections are run with integrity and that outcomes are fair, but perceptions about the prevalence of voter fraud raise concerns.

We hope that readers find this informative report as interesting as we do. Thank you for reading!

Adam Ambrogi
/
September 11, 2017

Democracy Fund’s Elections Program is excited to share our Election Administration and Voting systems map! The map, which was a collaboration involving advocates, academics, election officials, and policy experts, informs our thinking about American elections and our strategies for improving them. Below, you’ll read about our mapping journey, about potential leveraging opportunities within the system, and a request for your help as we continue to learn.

Though many aspects of the past election cycle were unique, there are ongoing challenges in election administration that pre-date 2016, as well as emerging opportunities for change. We hope that our work in elections will inform and support election officials, policy experts, advocates, peer funders, and most importantly—the American electorate.

Before diving in, our team would like to recognize all our colleagues who provided valuable feedback, and poured their time, energy, and perspectives into pulling this map together. Our collaboration stretched across the political spectrum, which generated robust conversations that inspired us as we created the map and used it to plan our strategy. We extend special thanks to Professor Paul Gronke, who provided support and academic consultation that was vital to the completion of this map.

Mapping the Election System

In December 2014, we convened a group of elections and voting experts to help us more deeply understand the U.S. election system. We began with the framing question, “to understand the election system in the United States, you need to understand…” A core story and key dynamics that drive the election system emerged through several follow up workshops, small group conversations, and internal research.

Because our initiative focuses on election administration, as well as the difficulty of comprehensively describing every aspect of the system, we predicated map construction on two assumptions—that mistakes in election administration:

  1. Are indicative of actionable problems, for which election officials require strong support to resolve; and
  2. Have serious downstream impacts on voters, who do not always have the time or knowledge needed to address issues before Election Day.

As shown in our core story, when elections are run ineffectively, there’s high potential for decreased public trust in the system, either because a voter heard about or personally experienced a problem. Sometimes those real or perceived barriers to voting have a deterring effect on voter engagement. These factors—“effective election administration,” “public trust in elections,” and “decision to vote”—appear relatively larger on the map because they are the key factors that drive the system and inform our work.

Low public trust in elections and low turnout increase pressure on lawmakers to change election laws and processes. Sometimes, those proposed changes lead to laws that, when well-implemented and voter-centric, improve elections. However, election administration is uniquely prone to election law gamesmanship, i.e., political actors who attempt to manipulate the rules or pressure officials to act in a partisan fashion. If policy changes are either intended or perceived to influence an election outcome or otherwise shift political power, then such changes can be caught up in a vicious cycle of gamesmanship—ultimately leaving election officials stuck with policies and processes that do not lead to better run elections.

The rest of the map illustrates the key dynamics that drive the core story. Key dynamics appear in 11 cyclical loops, which are:

  • Voter Registration
  • Election Official Education
  • Election Management
  • Technology Innovation
  • Voting Equipment
  • Integrity and Security
  • Ease of Voting
  • Voter Engagement
  • Education About Elections
  • Barriers to Voting
  • Election Law Gamesmanship

We binned each of the factors (i.e., dots) within these loops into one of four major categories:

  • Politics, law, and policy (green),
  • Elections process (light blue),
  • Voter engagement (yellow), and
  • “Other” (orange) for any one factor that does not neatly fit into any of the above categories.

We invite you to take a closer look at our map and its narrative, here and in Kumu – the tool we used to visualize the map. While reading the map, please note that pluses (+) and minuses (-) on connections (i.e., arrows) represent an increase and a decrease of that factor, respectively; the direction of the connections provides more information on the relationship between factors. (For example: when looking at the core story—as effective election administration decreases, public trust in elections decreases.)

From Map to Strategy

Our election and voting process can and should be improved; many election officials and voter advocates are already heading in that direction. After consulting with experts in the field and through much deliberation, we found several bright spots and potential points of leverage in the election system that could avoid political gamesmanship through bipartisan appeal and which present a high potential for impact, including:

  • Reducing stress on voter registration systems: States are rapidly adopting online voter registration and are becoming members of the Electronic Registration Information Center. There is also significant momentum around improving registration processes at motor vehicle departments and other state agencies. Improving voter registration systems could potentially result in tens of millions of newly registered, eligible citizens.
  • Improving the quality of election planning and execution: The growing community of civic technologists seeking to improve elections presents new opportunities for collaboration. Cost savings generated by new technology allows election officials to solve complex problems with few funds. Improving election processes has the potential to have positive downstream impacts on the voter experience, increasing the public’s confidence in election outcomes.
  • Increasing election officials’ capacity to adopt and implement new technology: Adoption and evaluation of tech tools that support election officials are gaining momentum. There is increasing interest among election community leaders in using and iterating these tools. Improving support for election officials using technology could have a transformative effect on the way elections are administered and on the way voters interact with the system, and without feeling overwhelming for the election official.
  • Increasing the public’s trust in elections: unsubstantiated allegations of widespread voter fraud are damaging and undermine the legitimacy of those in elected office. To foster trust in the system, voters must, at minimum, have a better understanding of the system’s key security features. Increased attention to security presents an opportunity to educate the public about election processes and to show how their election officials protect the integrity of the ballot. Given the new concerns about attempted interference in our election system by foreign actors, policy and practice must allow for officials’ ability to defend against potential attacks.

It will not be easy to improve the election system, nor will challenges be solved by any one organization alone. We understand that officials, advocates, experts, and voters all play a role in improving and promoting a healthy election system. Now that we have a framework, we can more easily identify where actors and activities occur within the elections and voting ecosystem, and have a better sense of where we should address problems.

How You Can Help

The map reflects our current understanding of the elections system in the United States and we hope that it captures key cyclical patterns that occur at the federal, state, and local levels. Of course, we are not able to capture every aspect of the system; we hope that we can rely on our larger community of stakeholders (you!) to help. As you navigate the map, please feel free to provide us with any feedback, questions, or comments by emailing us at electionsmap@democracyfund.org.

Thanks for viewing! We look forward to hearing from you.

Democracy Fund
1200 17th Street NW Suite 300,
Washington, DC 20036