Blog
In a nation of over 258.3 million eligible voters, election officials’ myriad duties differ from jurisdiction to jurisdiction—small to large, rural to urban—and from voter to voter. Despite these many differences, there are common themes and predictable challenges faced by every official. And of course, every official has experienced unforeseen events and unexpected circumstances that force them to assess, reform, and adapt. As any official will tell you, there is always another election on the horizon.
The Democracy Fund/Reed College Survey of Local Election Officials provides a window into the attitudes, actions, and needs of the public servants who manage US elections. Surveys during the last three election cycles have illustrated the stable features of the system and the way that the challenges of the moment impact the people administering the democratic process.
Local Election Officials
More than half of election officials are elected – 57 percent overall, but in small jurisdictions with fewer than 5,000 registered voters that increases to 67 percent – while 27 percent are appointed, and 15 percent are hired to fill a position. Just over half of these races are partisan and the other half are non-partisan, and the vast majority of elected officials (81 percent) ran uncontested in the general election. The need to attract candidates and talent will only continue to grow as veteran officials leave the field in growing numbers.
In the 2018 survey, officials’ recent experiences with foreign interference in election cybersecurity impacted the complexity of their work. In 2020, the pandemic and extraordinary polarization of the candidates and the electorate created stress and rapid change in methods of voting that election officials had to manage. The 2022 survey illustrates more emergent challenges as election officials report coping with the combinations of mis- and disinformation about elections, violence against election officials, and extreme partisan disparities in the public’s confidence in election results.
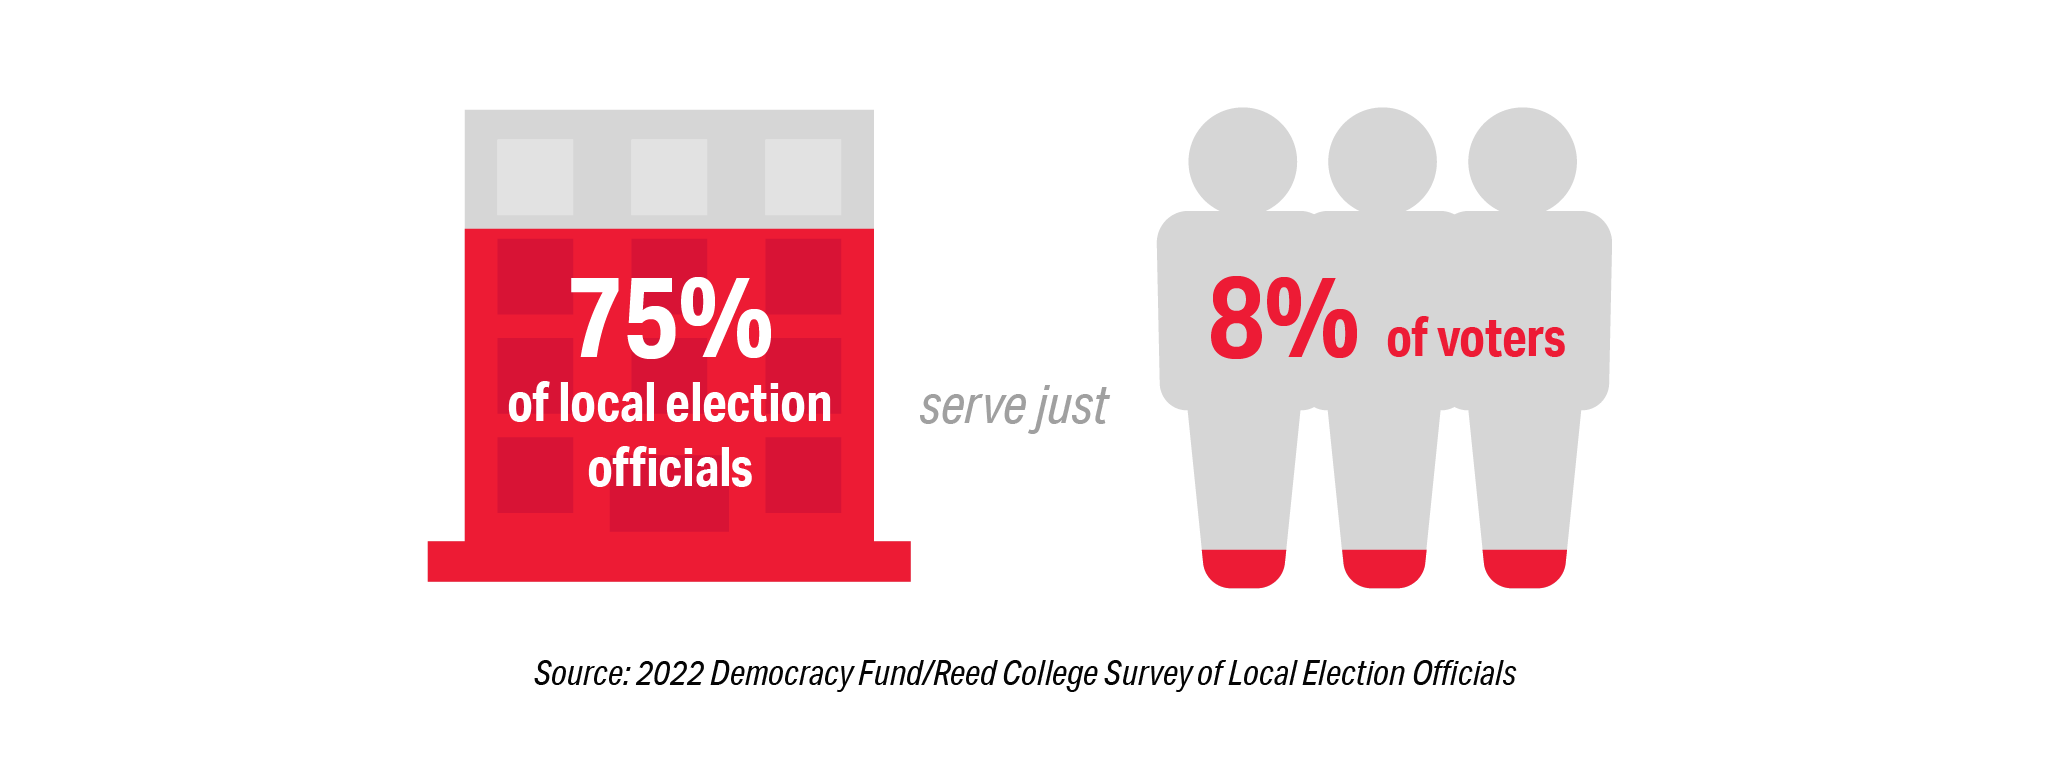
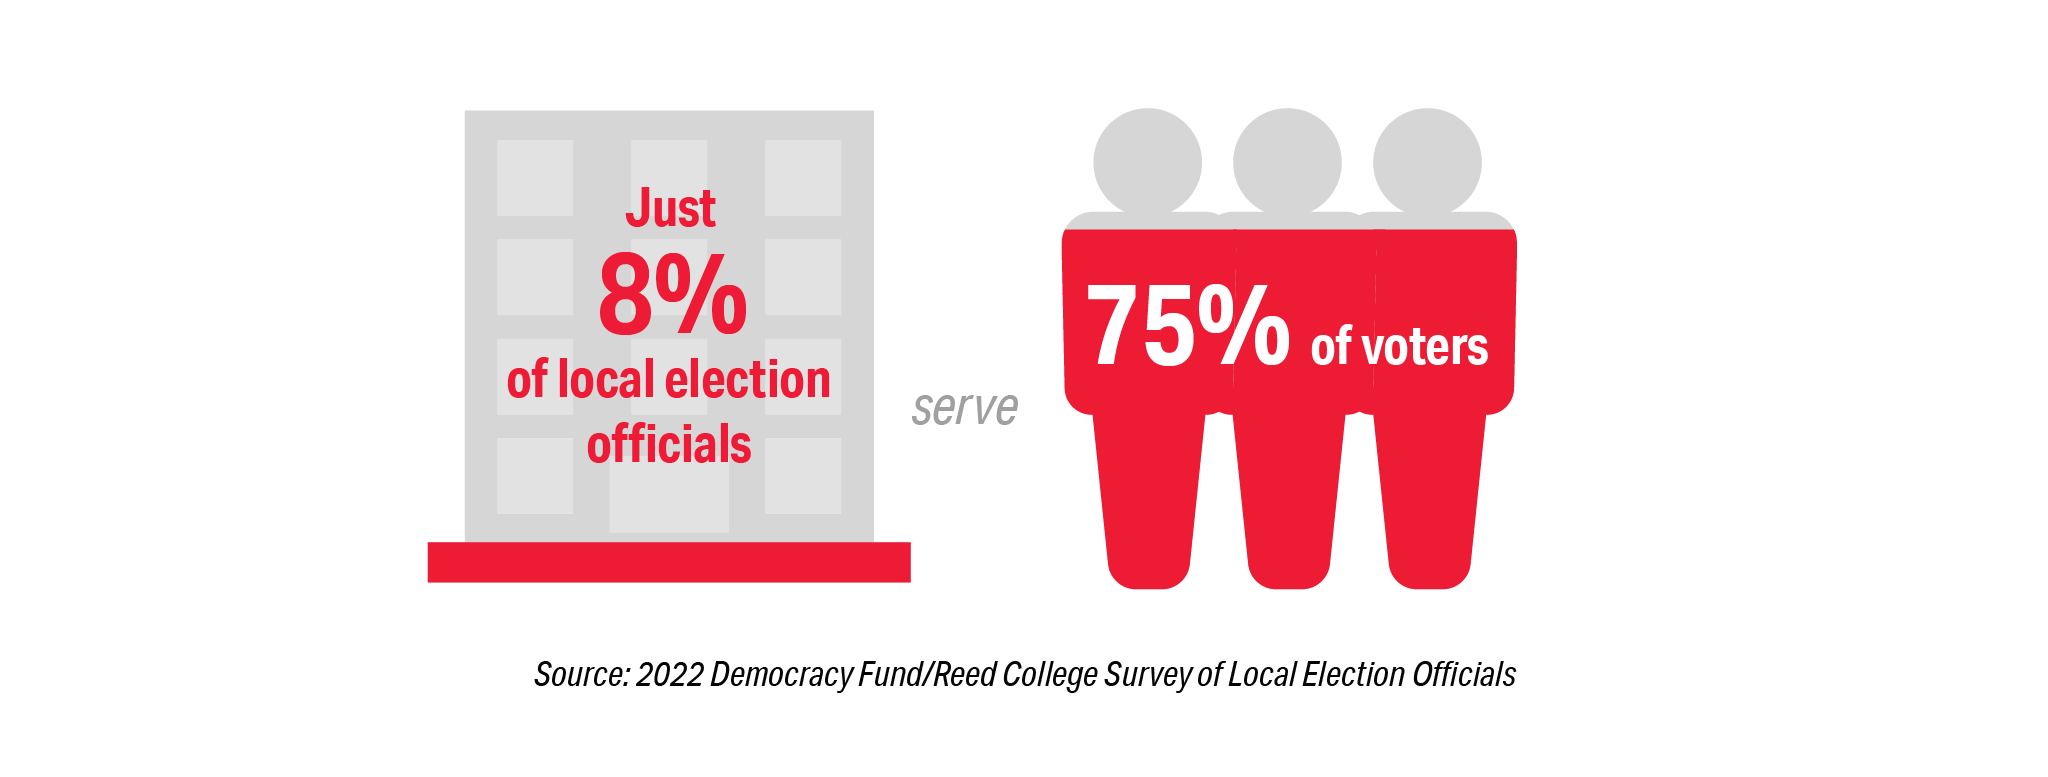
All of this is happening in an environment where the biggest disparity in the election system continues to be geographic. Elections are managed by local jurisdictions and there are tremendous differences between election offices that serve the largest and smallest populations. Seventy-five percent of all offices serve only 8 percent of voters, and 8 percent of our election offices serve 75 percent of voters. This disparity is driven by the fact that the largest 2 percent of offices serve half of the nation’s voters.
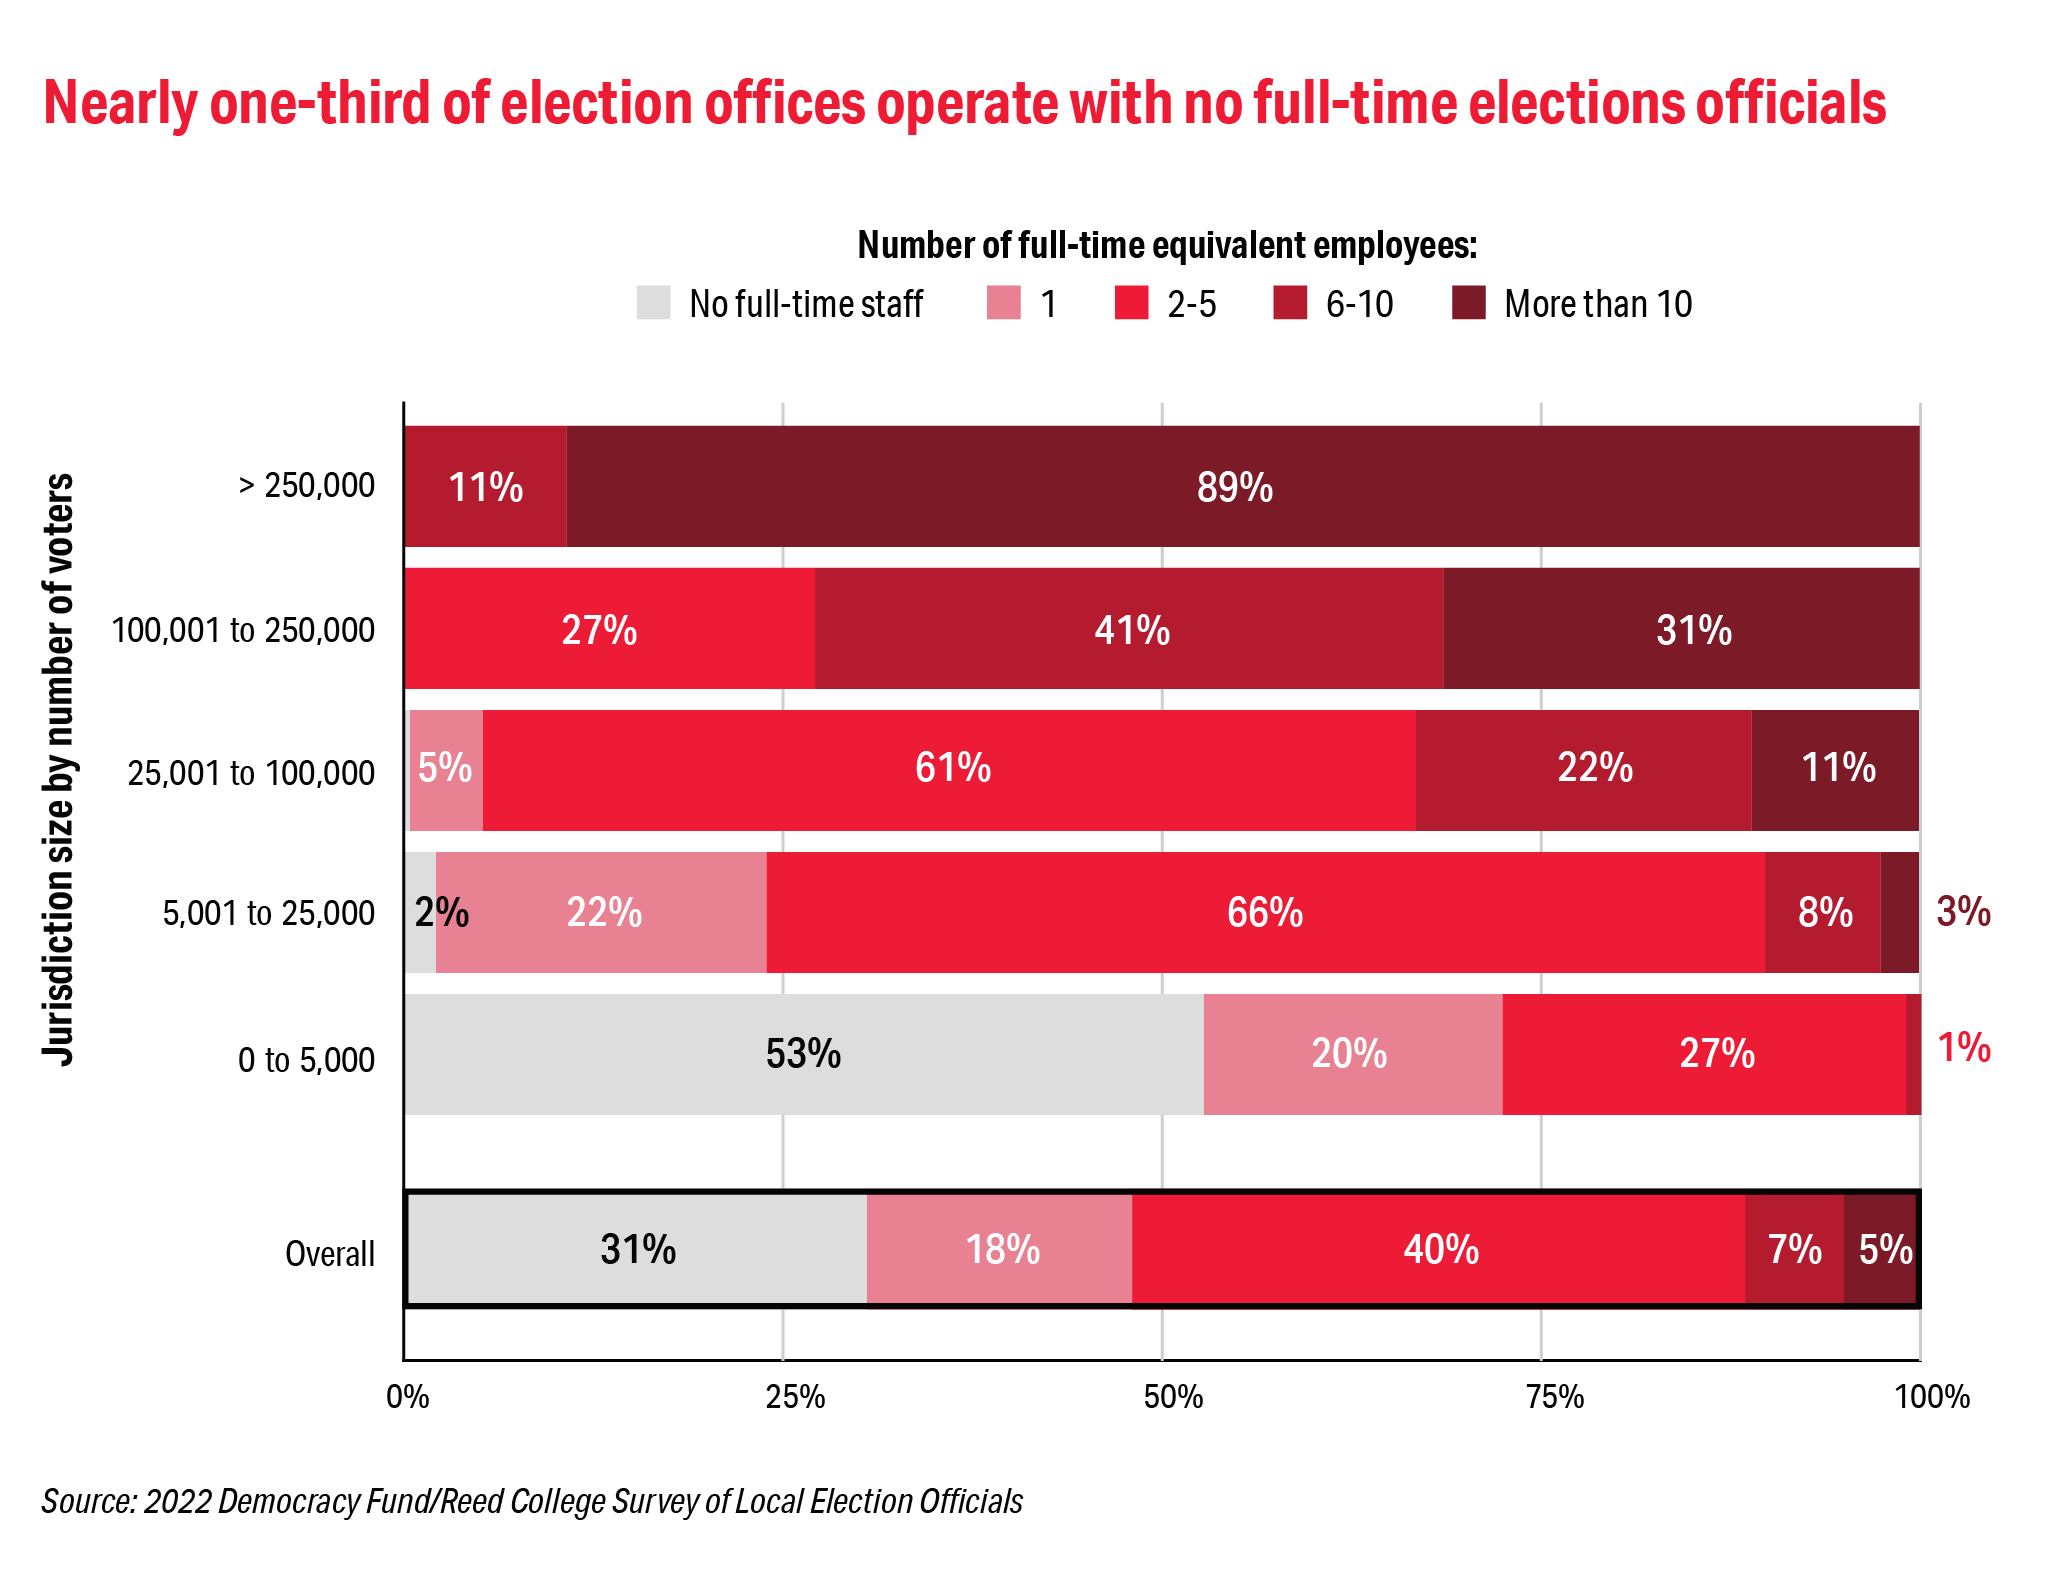
The impact of an increased election-related workload is disproportionally higher on smaller jurisdictions than their counterparts in medium and large jurisdictions. This should not be surprising since one third of all election offices do not have even one full-time employee. In small jurisdictions that serve less than 5,000 voters that number increases to 53 percent. The increased workload for many may have been the result of concerted campaigns to flood election offices with Freedom of Information Act requests around the 2020 election based on conspiracy and conjecture.
Each election cycle, the Democracy Fund/Reed College Local Election Official (LEO) Survey has asked local officials about key aspects of their work including preparedness for the upcoming election, job satisfaction, and training needs for the election officials and members of their staffs.
LEOs retain a commitment to meeting the demands of their jobs and the challenges of finding adequate polling locations and poll workers – especially sufficient bilingual workers and accessible facilities – persist with varying degrees across jurisdiction sizes.
Overall job satisfaction among LEOs remains high, but there are cracks in the veneer. The percentage of LEOs who do not think they can maintain a work/life balance has increased and the percentage who say their workload is reasonable has dropped since 2018.
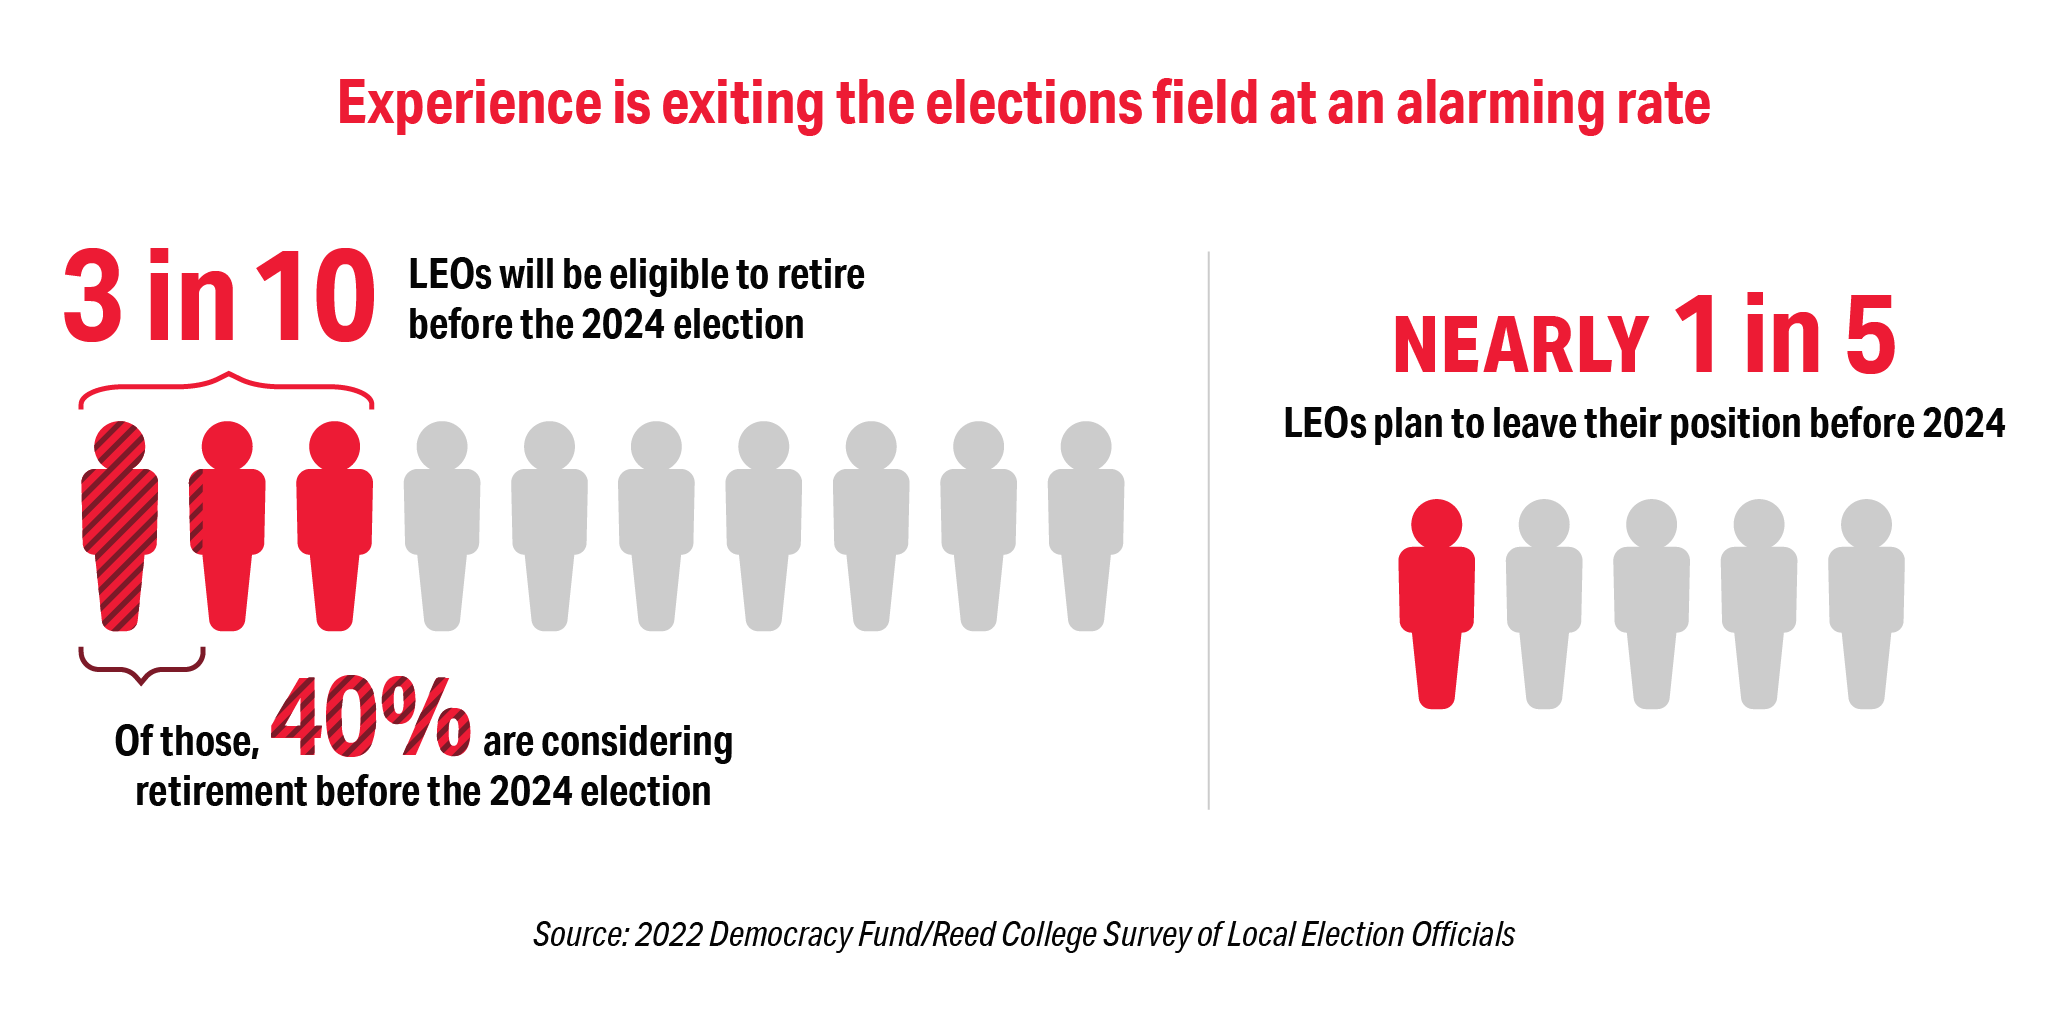
Among the 2022 survey participants, close to one third of the election officials are eligible to retire before the 2024 election—and 39 percent of those eligible plan to do so. Of these respondents, retirement eligibility is the highest reason for leaving the field (51 percent) but “I do not like the changes in my work environment that occurred during and after the November 2020 election” (42 percent) and “I do not enjoy the political environment” (37 percent) followed close behind. For those who are not near retirement age their number one reason for leaving the field was cited as “changes in how elections are administered make the work unsatisfying” (48 percent) and an alarming 28 percent citing that they plan to leave the field based on “concerns about my health or personal safety, aside from COVID concerns.”
Disruption in the Field
One in four respondents have experienced threats of violence. Officials across all jurisdiction sizes and political affiliations experienced these threats, but the threat environment is much more severe in larger jurisdictions compared to smaller jurisdictions. For example, while 14 percent of LEOs serving jurisdictions with less than 5,000 registered voters told us that they had experienced abuse, harassment, or threats, the percentage increases to two-thirds of LEOs serving in the largest jurisdictions. Similarly, 20 percent of LEOs who told us they were Republicans said they experienced threats, compared to 30 percent of Independents and 34 percent of Democrats. These differences should not disguise the overall result: threats against LEOs are far too real, far too regular, and far too common.
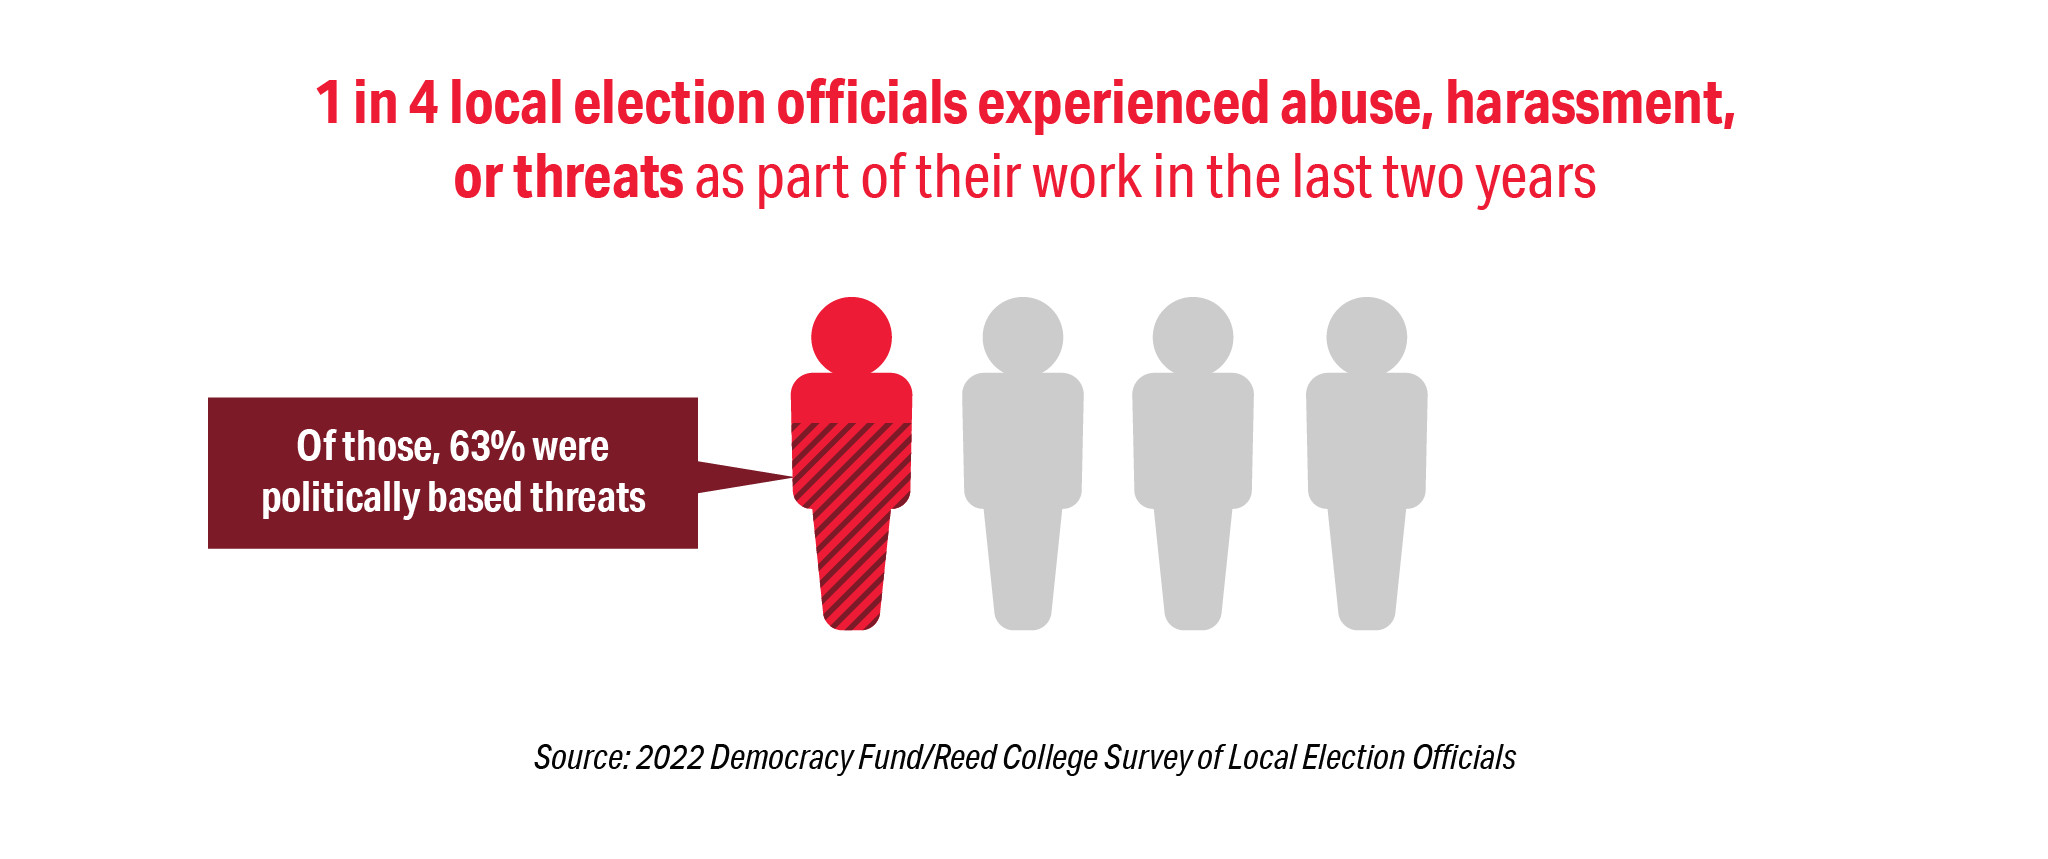
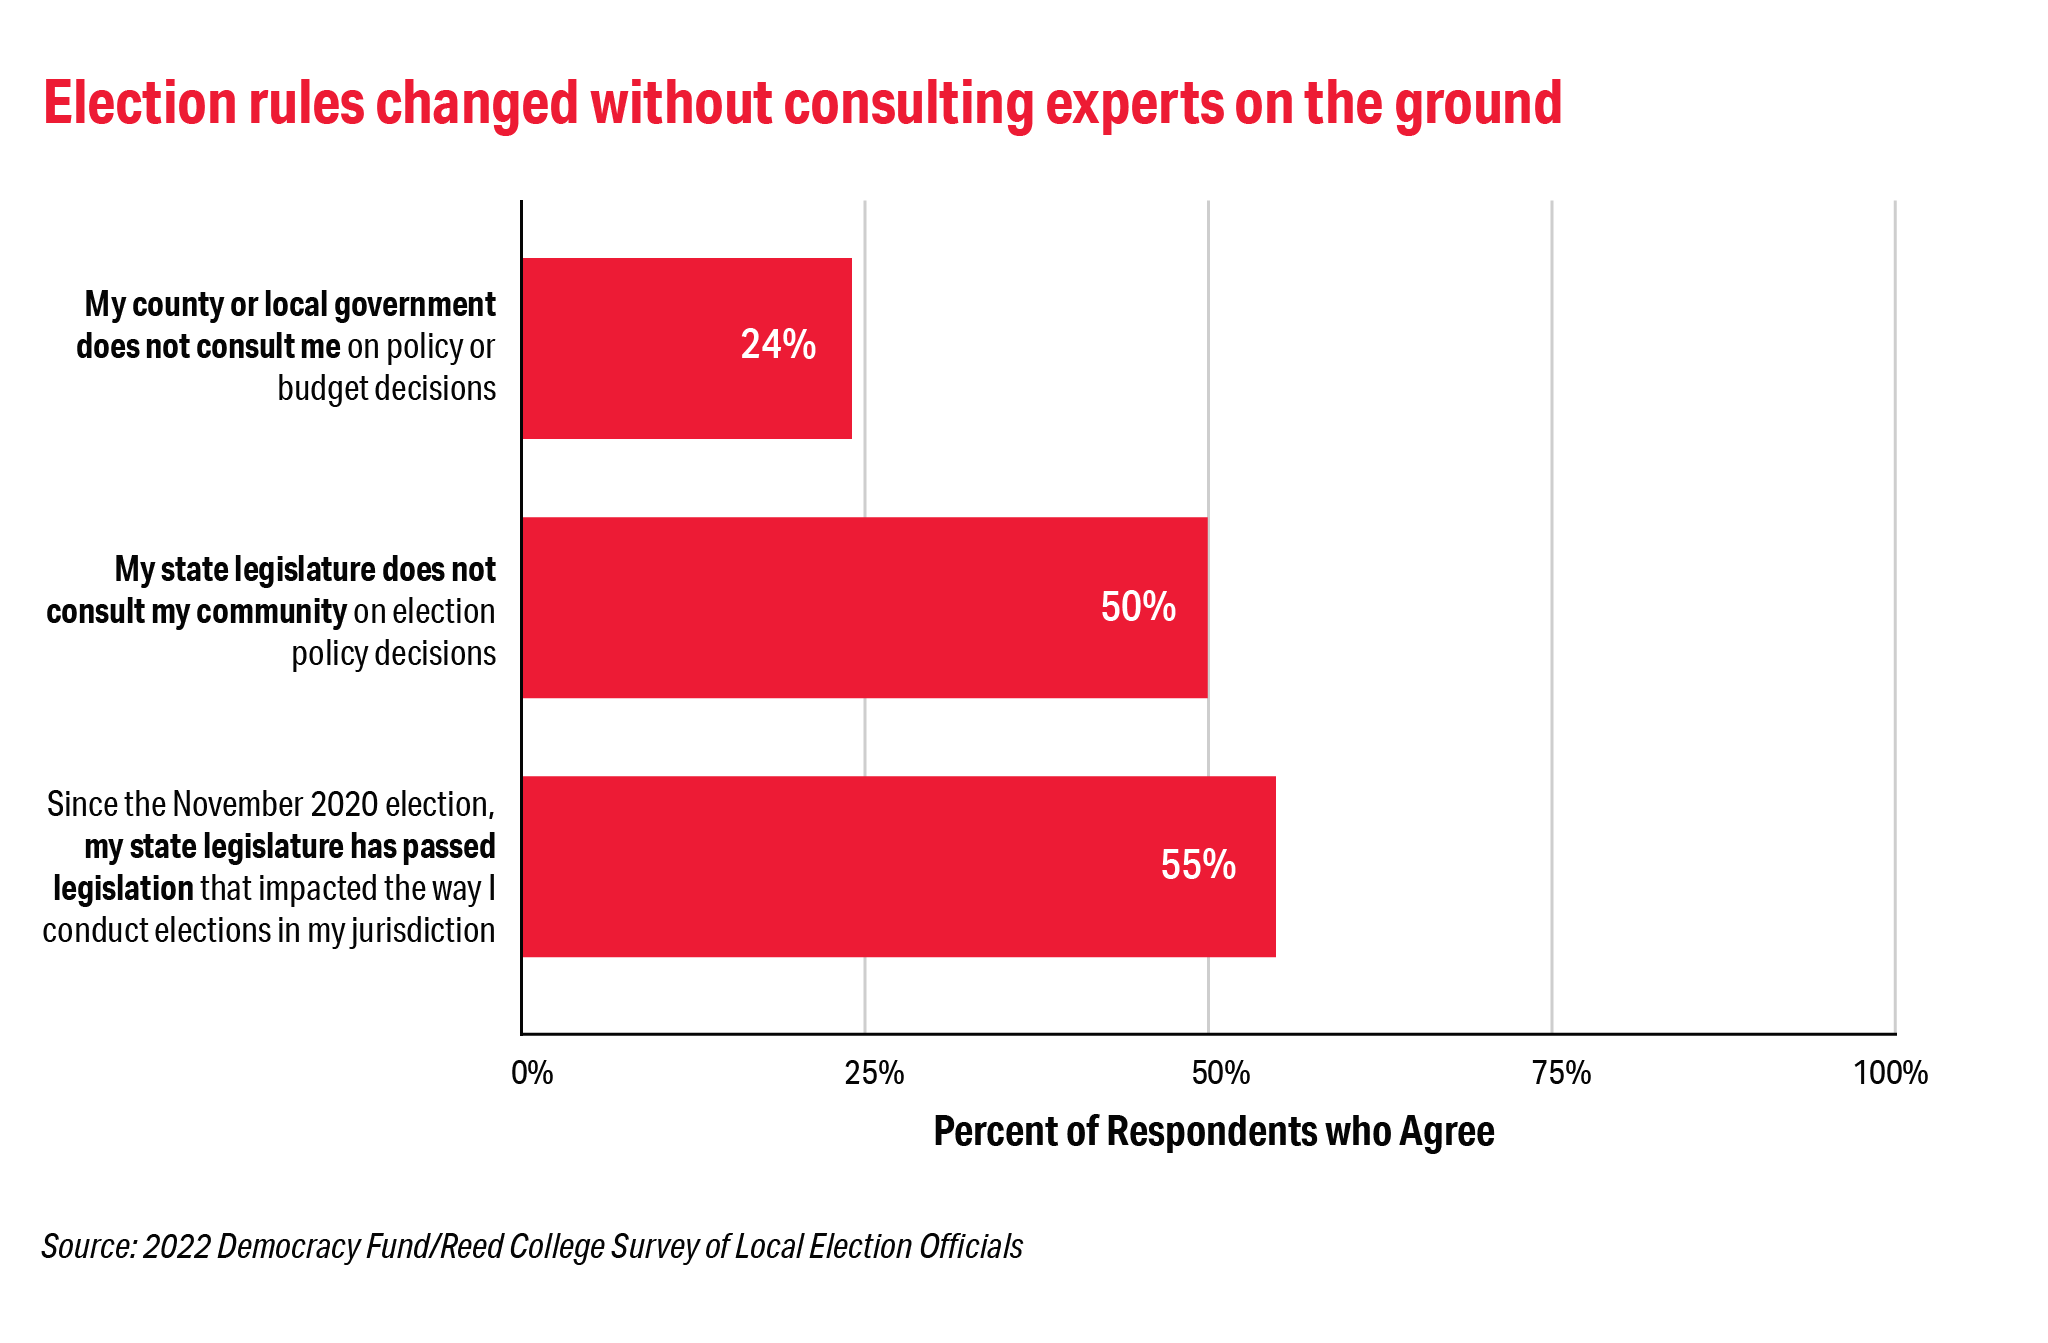
The preponderance of threats targeting election officials are politically based threats. Our 2022 survey showed that 63 percent of threats received were politically motivated. The narrative driving these threats—that the 2020 election was illegitimate and that LEOs were complicit in allowing the election to be stolen–-has manifested in threats to election professionals and their families, and changes to state election laws. More than half (55 percent) of the survey respondents said that they have had legislation passed that impacts how they conduct the election—with 35 percent saying those changes improved election administration and 46 percent saying the new laws did not improve election administration.
The majority – 66 percent – of election officials surveyed this year expressed concern about threats and harassment. When asked how seriously various organizations take the threats to election officials, 43 percent said that their state’s chief election official (in most states, the secretary of state) takes the threats “very seriously.” However, LEOs felt that others took the threats far less seriously: only 27 percent for local law enforcement, 25 percent for federal law enforcement, 17 percent for the state legislature and for the national media, 14 percent for the local media, and 12 percent for the U.S. Congress.
About the Survey and Interviews
The 2022 survey of local election officials was a self-administered web and hardcopy survey conducted from June 21 to September 22, 2022. This study used a LEO sample collected by the team, with a sampling frame based in part on national lists of local election officials and the sizes of their jurisdictions. From this frame, the team drew a sample of 3,118 LEOs, sampling jurisdictions in proportion to the number of registered voters they serve and targeting the chief election official in each jurisdiction to complete the survey. A total of 912 LEOs completed the survey, including 652 surveys completed via web (71 percent) and 260 (29 percent) completed via hardcopy with an overall response rate of 30 percent.
Survey findings are often presented by jurisdiction size to understand differences in experiences.
- Fifty-seven percent of local election officials serve in jurisdictions of 5,000 or fewer voters.
- Twenty-seven percent serve in jurisdictions of 5,001 to 25,000 voters.
- Ten percent serve in jurisdictions of 25,001 to 75,000 voters.
- Six percent serve in jurisdictions of more than 75,000 voters.
While most officials serve in small jurisdictions, the vast majority of voters live in large jurisdictions — over 70 percent of voters live in jurisdictions with more than 75,000 voters and are served by only 500 officials. It’s important to consider the possible differences in scale, responsibility, and resources between different jurisdiction sizes when interpreting results from any survey of this population. Where overall results are presented, they are weighted to ensure that means can be generalized to local election officials nationwide. Further information about the sampling and weighting process is available at the Reed College Elections & Voting Information Center’s project website.
Explore additional 2022 content and learn more about the Democracy Fund/Reed College Survey of Local Election Officials through Reed College’s Elections & Voting Information Center. Prior publications from the survey series are also available below.